Every trader has felt that rush when markets swing wildly, but few realize just how much hidden information a single number can reveal. The volatility index packs massive predictive power into one figure and the VIX in particular gives a 30-day forward projection of potential market movements. Most people just watch prices rise and fall, but those who understand volatility indices gain a secret window into market anxiety and can spot risks long before the rest of the crowd catches on.
Table of Contents
- Defining Volatility Index: What It Is And Its Purpose
- Why Volatility Index Matters: Significance In Markets
- How Volatility Index Works: The Basics Of Measurement
- Key Concepts Related To Volatility Index: Understanding The Metrics
- Real-World Applications Of Volatility Index In Trading
Quick Summary
| Takeaway | Explanation |
|---|---|
| Volatility index measures market uncertainty. | It provides insights into potential fluctuations in prices, reflecting investor sentiment and risk assessments. |
| Higher values indicate increased market anxiety. | When the index rises above typical levels, it suggests greater uncertainty and potential volatility in the market. |
| Use the index for strategic investment decisions. | Traders can apply insights from the index to adjust their portfolios, implement hedging strategies, and manage risk. |
| Understand different volatility ranges. | Values below 20 suggest calm markets, while those above 30 indicate significant turbulence and heightened risk. |
| Monitor the index for informed trading strategies. | Analyzing the volatility index helps anticipate market movements and optimize entry and exit points for trades. |
Defining Volatility Index: What it is and its Purpose
The volatility index represents a critical financial instrument that measures market uncertainty and investor sentiment. At its core, the volatility index tracks the expected fluctuations in market prices over a specific timeframe, providing traders and investors with a powerful tool to assess potential market risk and instability.
Understanding Market Volatility
Volatility measures the rate and magnitude of price movements in financial markets. When investors refer to what is volatility index, they are essentially discussing a numerical representation of market uncertainty. The most prominent example is the Chicago Board Options Exchange (CBOE) Volatility Index, commonly known as the VIX.
Key characteristics of market volatility include:
- Reflects investor expectations about future market movements
- Calculated using option prices from major stock indices
- Provides a forward-looking perspective on potential market turbulence
How the Volatility Index Works
The volatility index operates by analyzing the implied volatility of options contracts, primarily for the S&P 500 index. According to research from the Financial Industry Regulatory Authority, the index essentially predicts the anticipated 30-day volatility in the market.
Traders and investors use the volatility index as a critical tool for:
- Assessing potential market risk
- Making informed investment decisions
- Understanding overall market sentiment
When the volatility index rises, it typically indicates increased market uncertainty and potential investor anxiety. Conversely, lower values suggest more stable market conditions and greater investor confidence. By monitoring these fluctuations, traders can develop more strategic approaches to managing their investment portfolios and mitigating potential risks.
Why Volatility Index Matters: Significance in Markets
The volatility index serves as a critical barometer for understanding market dynamics, offering investors and traders profound insights into potential financial risks and market sentiment. By translating complex market movements into a comprehensible numerical representation, the volatility index becomes an essential tool for strategic decision making.
Market Risk Assessment
Understanding market risk is fundamental to successful trading and investment strategies. The volatility index provides a quantitative measurement of potential market uncertainty, enabling investors to gauge potential future market behavior. According to research from NYU Stern School of Business, volatility indices help traders anticipate potential market turbulence and adjust their investment approaches accordingly.
Key risk assessment aspects include:
- Identifying potential market downturns
- Measuring investor confidence levels
- Predicting potential portfolio volatility
Strategic Investment Decision Making
Traders and institutional investors rely on the volatility index to make informed investment decisions. The index offers a forward-looking perspective that goes beyond historical price movements, providing real-time insights into market expectations. By understanding potential market fluctuations, investors can:
- Implement hedging strategies
- Adjust portfolio allocations
- Manage potential investment risks
The volatility index essentially acts as a predictive tool, helping investors navigate complex market environments with greater precision. When the index shows high volatility, it signals increased market uncertainty, prompting more cautious investment approaches. Conversely, lower volatility suggests more stable market conditions, potentially encouraging more aggressive investment strategies.
Ultimately, the volatility index is not just a number but a comprehensive market sentiment indicator that reflects collective investor psychology and anticipated market movements. By providing a transparent, data-driven perspective on market expectations, it remains an indispensable tool for traders seeking to understand and navigate financial markets effectively.
How Volatility Index Works: The Basics of Measurement
The volatility index represents a sophisticated mathematical approach to quantifying market uncertainty, translating complex financial data into a single, comprehensible numeric indicator. By measuring the expected price fluctuations of financial instruments, the volatility index provides traders and investors with a powerful predictive tool.
Calculating Volatility Index
The measurement of the volatility index involves a complex process of analyzing option prices and implied volatility. According to Investopedia, the most prominent volatility index calculates market expectations using a wide range of S&P 500 index options, providing a 30-day forward projection of potential market movements.
Key components of volatility index calculation include:
- Analyzing option contract prices
- Measuring implied volatility across different strike prices
- Aggregating data from multiple financial instruments
Interpreting Volatility Measurements
Understanding the volatility index requires recognizing its nuanced representation of market sentiment. The numeric value provides insights into potential market behavior, with different ranges indicating varying levels of investor uncertainty.
Volatility index interpretation typically follows these principles:
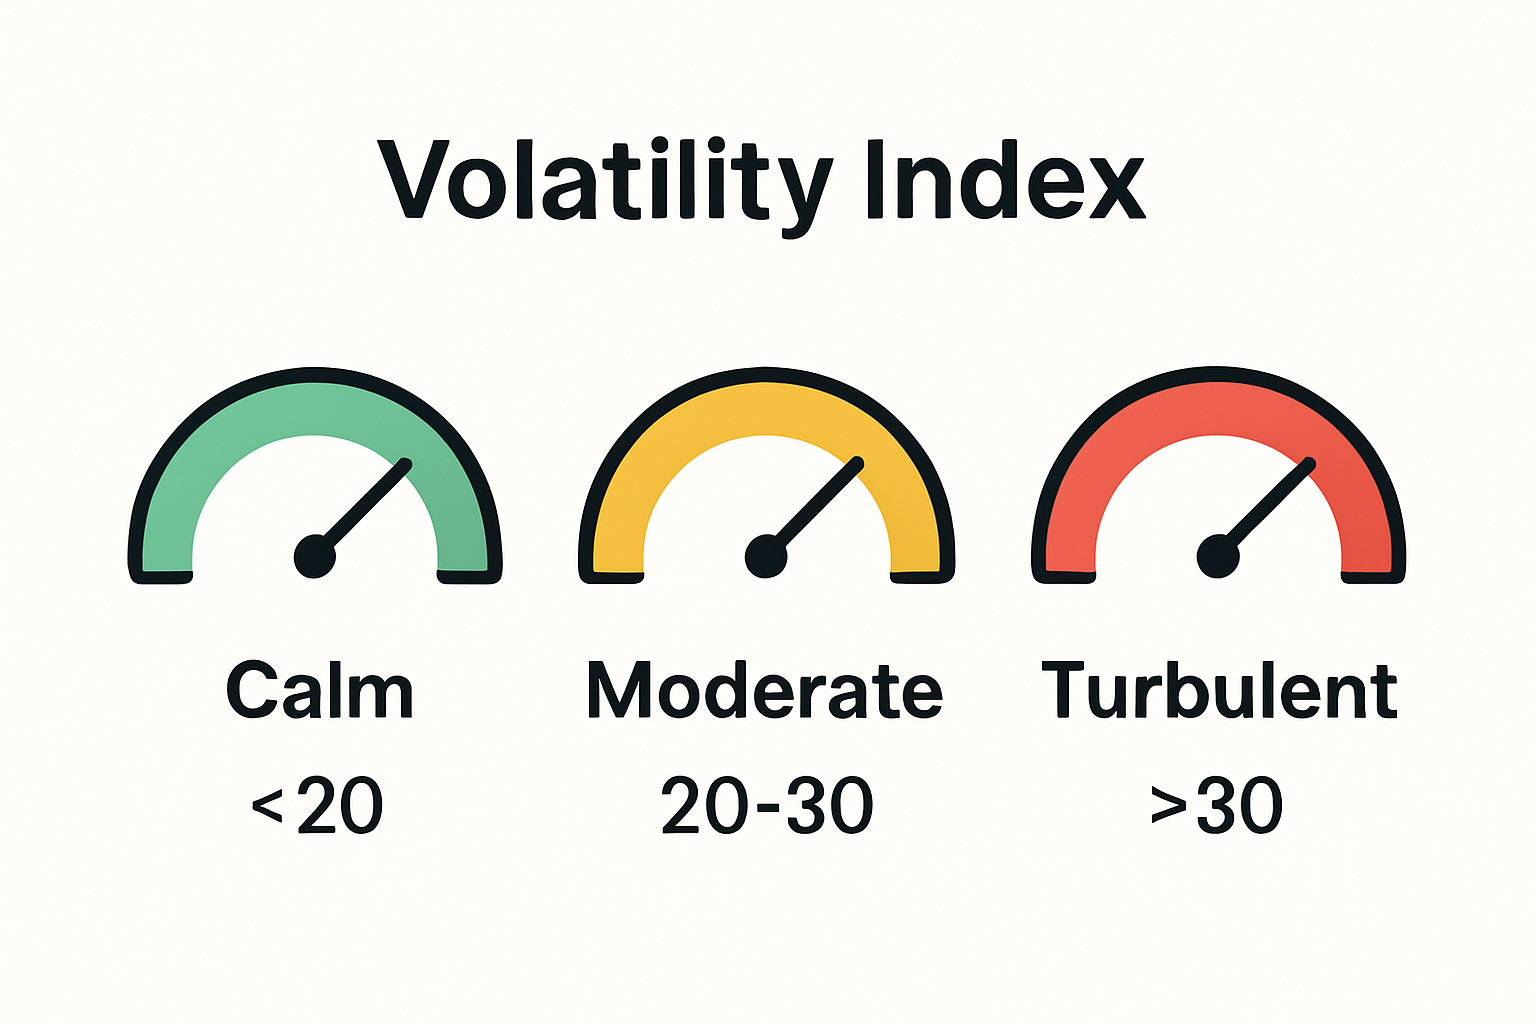
- Values below 20 suggest relatively calm market conditions
- Values between 20-30 indicate moderate market uncertainty
- Values above 30 signal significant market turbulence
Traders use these measurements to assess potential market risks, develop strategic investment approaches, and make informed decisions about portfolio management. By providing a forward-looking perspective on market expectations, the volatility index transforms complex financial data into an accessible tool for understanding potential market dynamics.
Key Concepts Related to Volatility Index: Understanding the Metrics
The volatility index encompasses several sophisticated metrics that help traders and investors understand market dynamics beyond simple price movements. By breaking down complex financial data into comprehensible measurements, these metrics provide deeper insights into market behavior and potential risks.
Implied Volatility Fundamentals
Implied volatility represents a critical concept in understanding market expectations. According to research from Pennsylvania State University, implied volatility measures the market’s forecast of potential price movements, going beyond historical data to predict future market behavior.
Key characteristics of implied volatility include:

- Reflects market sentiment and future expectations
- Derived from option pricing models
- Provides a forward-looking perspective on potential market fluctuations
Standard Deviation and Volatility Measurements
Standard deviation serves as a fundamental statistical tool for quantifying market volatility. This metric helps traders understand the potential range of price movements and assess potential investment risks. By measuring the dispersion of financial instrument prices from their average value, standard deviation offers a quantitative approach to understanding market uncertainty.
Various volatility measurement techniques include:
- Moving standard deviation calculations
- Exponentially weighted volatility models
- Historical volatility comparisons
Traders utilize these metrics to develop sophisticated investment strategies, manage portfolio risks, and make informed decisions based on comprehensive market analysis. By understanding the nuanced metrics associated with the volatility index, investors can navigate complex financial landscapes with greater confidence and precision.
Real-World Applications of Volatility Index in Trading
The volatility index transcends theoretical calculations, serving as a powerful practical tool for traders across various financial markets. By providing actionable insights into market sentiment and potential price movements, the volatility index enables sophisticated trading strategies and risk management approaches.
Trading Strategy Development
Researchers examining global stock market dynamics have demonstrated how the volatility index can be instrumental in developing nuanced trading strategies. Traders utilize volatility measurements to anticipate potential market shifts, adjusting their investment approaches based on comprehensive risk assessments.
Key strategic applications include:
- Identifying potential market entry and exit points
- Implementing hedging strategies
- Assessing portfolio risk exposure
Risk Management Techniques
Professional traders and institutional investors leverage the volatility index as a critical risk management tool. By understanding market uncertainty levels, traders can make informed decisions about position sizing, portfolio allocation, and potential defensive maneuvers.
Risk management approaches using volatility index include:
- Calculating potential portfolio drawdowns
- Adjusting investment allocations during high volatility periods
- Implementing options strategies based on market sentiment
Beyond individual trading decisions, the volatility index provides a broader perspective on market psychology. When volatility increases, it signals potential market turbulence, prompting traders to adopt more conservative strategies. Conversely, lower volatility periods might encourage more aggressive investment approaches, reflecting the dynamic nature of financial markets.
Transform Market Uncertainty Into Trading Confidence with FrankFX
Are market swings and unpredictable volatility making your trading decisions stressful? If you want real answers for managing the challenges discussed in our article—like understanding what the volatility index means for your trades and using those insights to limit risk—you are not alone. At FrankFX, we help traders like you convert market complexity into clear, actionable strategies. With access to expert mentorship, daily trading signals, advanced analytics, and real-time education on concepts like implied volatility, you can build resilience and confidence in every market condition.
Take charge of your trading journey right now. Explore our platform at FrankFX where you will find free forex calculators, automated trading robots, and a vibrant trading community sharing signals and analysis daily. Join today to unlock exclusive VIP mentorship and live sessions that help you put volatility index insights into practice. Stop letting uncertainty dictate your trades—empower your decisions with FrankFX and see the difference today.
Frequently Asked Questions
What is the Volatility Index and how does it work?
The Volatility Index measures market uncertainty by tracking expected price fluctuations over a specific timeframe, primarily using option prices from major stock indices like the S&P 500.
Why is the Volatility Index important for traders?
The Volatility Index is crucial as it helps traders assess potential market risks, understand overall market sentiment, and make informed investment decisions based on anticipated market movements.
How can traders use the Volatility Index for risk management?
Traders can use the Volatility Index to gauge market uncertainty, adjust portfolio allocations, and implement hedging strategies during periods of high volatility to mitigate potential risks.
How are Volatility Index values interpreted?
Values below 20 indicate calm market conditions, between 20 and 30 suggest moderate uncertainty, and values above 30 signal significant market turbulence, helping traders adjust their strategies accordingly.
Below is a comparison table that summarizes how different volatility index value ranges are interpreted and what they reveal about market conditions and investor sentiment.
| Volatility Index Range | Market Conditions | Investor Sentiment | Typical Implications |
|---|---|---|---|
| Below 20 | Calm, stable | Confident | Low risk, steady market |
| 20 – 30 | Moderate uncertainty | Cautious/Watchful | Watch for potential changes |
| Above 30 | Turbulent, unstable | Anxious/Worried | High risk, increased volatility, possible sell-offs |
Recommended
- Videos | FRANKFX TRADING ACADEMY
- FRANKFX TRADING ACADEMY | TRADING
- FRANKFX TRADING ACADEMY | TRADING
- FRANKFX TRADING ACADEMY | TRADING
