Forex charts look intimidating at first with all their lines, colors, and patterns filling the screen. Most traders assume mastering them requires advanced math or relentless hours of study. But the real surprise is that just three basic chart types and a handful of visual cues hold the key—more than 90% of successful traders rely on simple candlestick, line, or bar charts for their daily moves. You do not need to be a math whiz to spot reversals, trends, or trading opportunities. The secret is knowing exactly what to look for—and the steps to read them with confidence.
Table of Contents
- Understanding The Basics Of Forex Charts
- Different Types Of Forex Charts Explained
- Key Chart Patterns And Trends To Watch
- Practical Tips For Better Chart Analysis
Quick Summary
| Takeaway | Explanation |
|---|---|
| Understand chart types: line, bar, candlestick | Each chart type provides unique insights; candlestick charts deliver the most comprehensive market information. |
| Identify key technical indicators: MA, RSI, MACD | These indicators help traders interpret market signals and identify potential trading opportunities. |
| Recognize reversal and continuation patterns | Knowing these patterns can help foresee market turnarounds or trend continuations for strategic trading. |
| Develop a structured analysis approach | A systematic method incorporating multiple indicators and timeframes enhances decision-making and risk management. |
| Utilize volume analysis to confirm trends | Volume context adds depth to price movements, indicating trend validity and potential reversals. |
Understanding the Basics of Forex Charts
Forex charts are essential tools that allow traders to visualize currency price movements and analyze market trends. These graphical representations transform complex trading data into visual formats that help traders make informed decisions about potential trading opportunities.
Types of Forex Charts
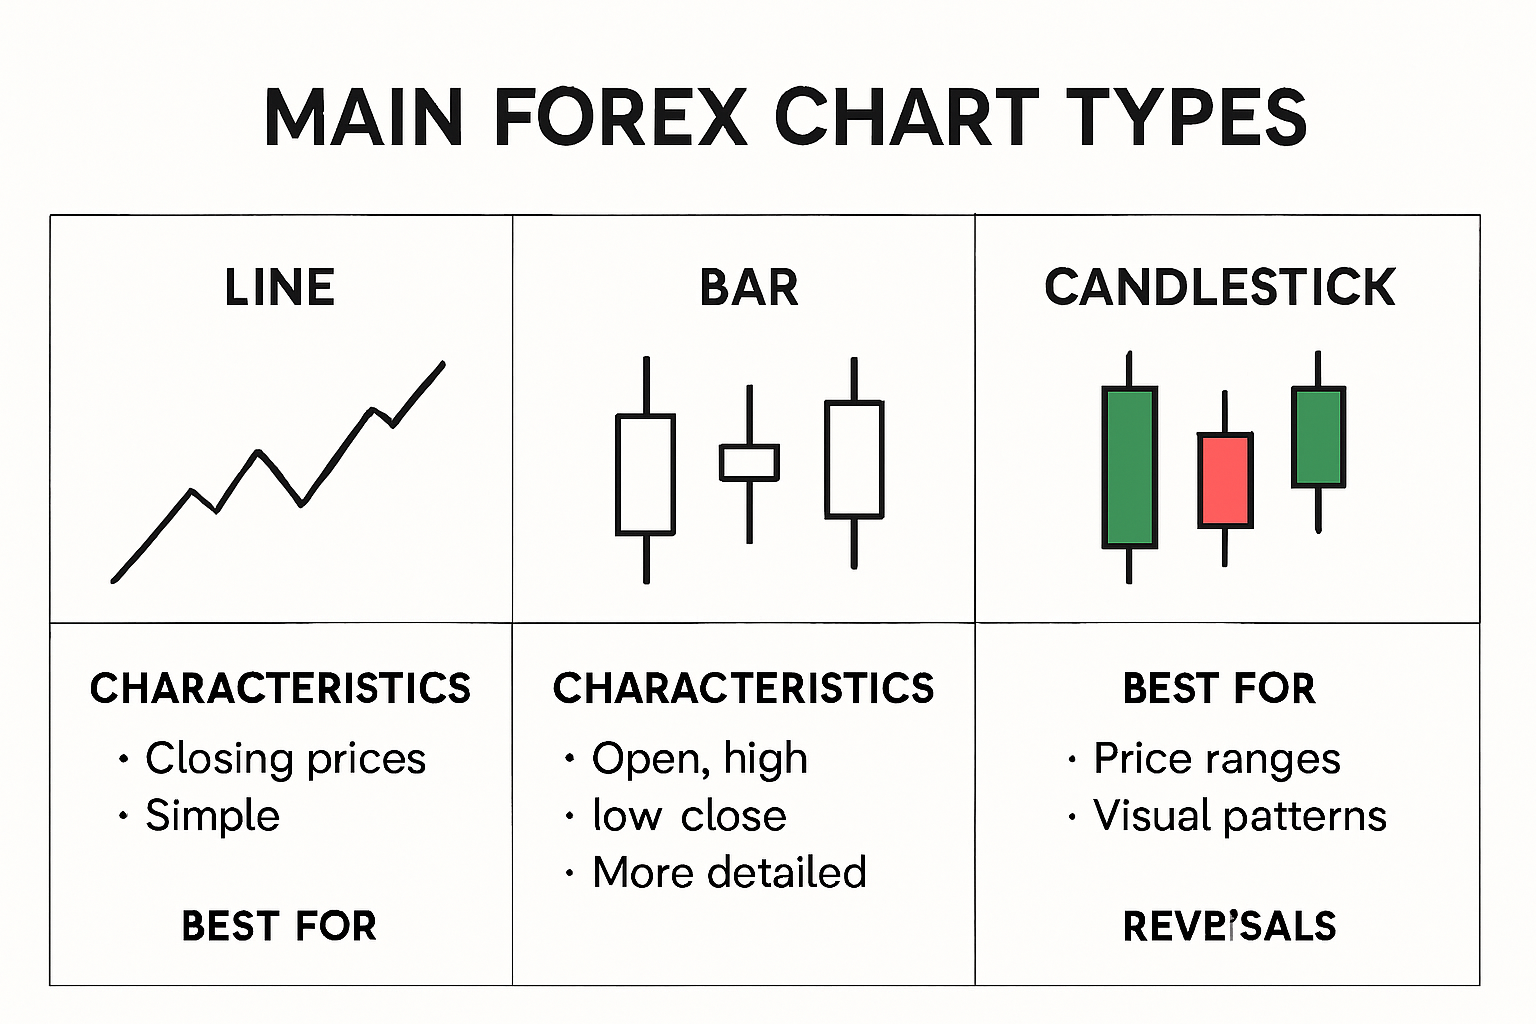
Traders have several chart types at their disposal, each offering unique insights into market behavior. Forex University highlights three primary chart types that traders commonly use:
- Line Charts: The simplest representation, connecting closing prices over time to show overall price trajectory
- Bar Charts: Display opening, closing, high, and low prices within a specific time period
- Candlestick Charts: Provide most comprehensive price information, showing price movements with color-coded “candles”
Candlestick charts are particularly popular among traders because they offer more detailed market sentiment information. A green or white candle indicates the price closed higher than it opened, while a red or black candle shows the price closed lower.
Key Technical Indicators
To effectively read forex charts, traders rely on technical indicators that help interpret market signals. IG’s comprehensive guide outlines several critical indicators traders use:
- Moving Averages: Help identify price trend direction by smoothing out price fluctuations
- Relative Strength Index (RSI): Measures momentum and identifies potential overbought or oversold conditions
- Stochastic Oscillator: Compares a closing price to its price range over a specific period
- MACD (Moving Average Convergence Divergence): Tracks momentum and potential trend changes
Understanding these indicators allows traders to detect subtle market movements and potential trading opportunities before they become obvious to everyone.
Reading Chart Patterns
Successful forex trading requires more than just understanding chart types and indicators. The Reserve Bank of Australia’s educational resources emphasize the importance of comprehending chart components like axes, scales, and data points.
Traders should pay close attention to:
- Support levels (where buying interest prevents further price drops)
- Resistance levels (where selling interest prevents further price increases)
- Price momentum
- Trend directions
By developing a systematic approach to reading forex charts, traders can transform raw market data into actionable trading strategies. Remember that chart reading is both an art and a science, requiring consistent practice and continuous learning.

Whether you’re a beginner or an experienced trader, mastering forex chart interpretation is crucial for making informed trading decisions and minimizing potential risks in the dynamic world of currency trading.
Different Types of Forex Charts Explained
Forex charts are vital visual tools that transform complex currency trading data into comprehensible graphical representations. Investopedia highlights that different chart types offer unique perspectives on market movements, enabling traders to make more informed decisions.
Line Charts: The Simplest Visualization
Line charts represent the most basic and straightforward method of tracking currency price movements. These charts connect closing prices over a specific time period, creating a continuous line that shows the overall price trajectory. Traders appreciate line charts for their simplicity and ability to provide a quick overview of price trends.
While line charts offer a clean and uncluttered view of price movements, they have limitations. By only displaying closing prices, they omit crucial information about price volatility within each trading period. This means traders miss out on understanding the full range of price fluctuations that occur during each time interval.
Bar Charts: Detailed Price Information
Nasdaq’s trading analysis explains that bar charts provide significantly more detailed price information compared to line charts. Each bar represents a specific time period and contains four key price points:
- Open Price: The initial trading price for the period
- Close Price: The final trading price for the period
- High Price: The highest price reached during the period
- Low Price: The lowest price reached during the period
The vertical line of a bar chart represents the total price range, with horizontal lines on the left and right indicating opening and closing prices. A bar with a longer vertical line suggests higher price volatility, while a shorter line indicates more stable trading conditions.
Candlestick Charts: Comprehensive Market Insights
Candlestick charts are widely considered the most informative and visually intuitive chart type for forex traders. Each “candle” represents a specific time period and provides a wealth of information about price movements and market sentiment.
The candle consists of two primary components:
- Body: The thick part of the candle representing the range between opening and closing prices
- Wicks/Shadows: Thin lines extending from the body showing the highest and lowest prices
Color coding adds another layer of information:
- Green/White Candles: Price closed higher than it opened (bullish)
- Red/Black Candles: Price closed lower than it opened (bearish)
Traders use candlestick patterns to understand market psychology and predict potential price movements. Patterns like “hammer,” “shooting star,” and “doji” can signal potential trend reversals or continuation.
While each chart type offers unique advantages, successful forex trading requires understanding their strengths and limitations. Experienced traders often use multiple chart types and combine them with technical indicators to develop comprehensive trading strategies.
To help you quickly compare the main features, strengths, and weaknesses of the three primary forex chart types, here is a comparison table:
| Chart Type | Key Features | Main Advantages | Main Limitations |
|---|---|---|---|
| Line Chart | Connects closing prices over time | Simple, easy overview of trends | Lacks detail, omits price volatility |
| Bar Chart | Shows open, high, low, and close for each period | More detailed price information | Visually complex, can be harder to interpret |
| Candlestick Chart | Color-coded candles for OHLC data & sentiment | Most comprehensive & intuitive insights | Can appear crowded, requires learning patterns |
Mastering these chart types is crucial for interpreting market data effectively, identifying trading opportunities, and making informed decisions in the dynamic world of forex trading.
Key Chart Patterns and Trends to Watch
Forex chart patterns are critical tools that help traders predict potential market movements and make informed trading decisions. These visual representations reveal underlying market psychology and provide insights into potential future price actions.
Reversal Patterns: Identifying Market Turning Points
Technical Analysis from TradingView explains that reversal patterns signal potential changes in existing market trends. These patterns indicate when a current price trend might be losing momentum and preparing to change direction.
Key reversal patterns include:
- Head and Shoulders: A classic pattern resembling a human head and shoulders, signaling a potential trend reversal
- Double Top/Bottom: Indicates potential trend exhaustion and upcoming price reversal
- Inverse Head and Shoulders: Suggests a potential bullish trend after a bearish market phase
Traders must recognize these patterns early to capitalize on potential market shifts. Successful identification requires careful observation and understanding of subtle market dynamics.
Continuation Patterns: Confirming Existing Trends
Investopedia’s Market Analysis defines continuation patterns as chart formations that suggest the current market trend is likely to persist. These patterns provide traders with confidence in maintaining their existing trading positions.
Important continuation patterns include:
- Triangles: Represent market consolidation and potential future breakout
- Flags and Pennants: Short-term pauses in a strong trend before resuming the previous direction
- Rectangles: Horizontal trading ranges indicating temporary market equilibrium
Recognizing these patterns helps traders make strategic decisions about entering or maintaining positions during periods of market consolidation.
Below is a summary table outlining the most common forex chart patterns mentioned in the article, what they signal, and where they generally occur in trends. Use this as a quick reference for pattern identification:
| Pattern Name | Indicates | Typical Context |
|---|---|---|
| Head and Shoulders | Trend reversal (bearish) | At market peaks |
| Inverse Head & Shoulders | Trend reversal (bullish) | At market bottoms |
| Double Top/Bottom | Trend reversal | Trend exhaustion (peaks/bottoms) |
| Triangles | Continuation (breakout) | During consolidations |
| Flags & Pennants | Trend continuation | After strong price moves |
| Rectangles | Sideways/trend continuation | Temporary price equilibrium |
Trend Analysis: Understanding Market Direction
Trend analysis involves identifying and following the overall market direction. Traders distinguish between three primary trend types:
- Uptrend: Characterized by progressively higher highs and higher lows
- Downtrend: Marked by progressively lower highs and lower lows
- Sideways/Horizontal Trend: Indicates minimal price movement and market uncertainty
Effective trend analysis requires understanding support and resistance levels, which act as psychological price barriers. Support represents price levels where buying interest prevents further decline, while resistance represents levels where selling pressure prevents price increases.
Sophisticated traders use multiple timeframe analysis to confirm trends, comparing short-term, medium-term, and long-term chart perspectives. This approach provides a more comprehensive view of potential market movements.
Mastering chart patterns and trends is not about perfect prediction but about understanding probabilities. No pattern guarantees a specific outcome, making risk management and continuous learning essential in forex trading. Traders should combine pattern recognition with robust risk management strategies to navigate the complex forex market successfully.
Practical Tips for Better Chart Analysis
Effective forex chart analysis requires more than just recognizing patterns. It demands a systematic approach, disciplined methodology, and continuous learning. Investopedia highlights the critical importance of developing a consistent trading strategy that goes beyond simple pattern recognition.
Developing a Robust Analysis Framework
Successful chart analysis begins with establishing a structured approach. Traders must create a comprehensive methodology that includes multiple layers of evaluation. This means looking beyond single indicators and developing a holistic view of market movements.
Key components of a robust analysis framework include:
- Multiple Timeframe Analysis: Comparing chart patterns across different time periods
- Confirmation Signals: Using multiple indicators to validate potential trading opportunities
- Risk Management Parameters: Predefined rules for entry, exit, and position sizing
Traders should avoid making impulsive decisions based on a single chart pattern or indicator. Instead, develop a disciplined approach that considers multiple market factors and potential scenarios.
Understanding Volume and Market Dynamics
Forex University emphasizes the critical role of volume analysis in interpreting market movements. Volume provides crucial context to price actions, helping traders distinguish between meaningful market trends and temporary fluctuations.
Practical volume analysis techniques include:
- Comparing Volume to Price Movements: High-volume price changes are typically more significant
- Identifying Trend Confirmation: Volume can validate or challenge existing price trends
- Detecting Potential Reversals: Unusual volume patterns may signal upcoming market shifts
Traders should pay special attention to volume spikes, which often indicate increased market interest or potential trend changes. A price movement accompanied by high volume carries more weight than one with minimal trading activity.
Advanced Charting Techniques
Advanced traders go beyond basic chart reading by incorporating sophisticated analytical approaches. This involves combining technical analysis with broader market understanding, including economic indicators, global events, and market sentiment.
Effective advanced charting techniques include:
- Correlation Analysis: Understanding how different currency pairs interact
- Fibonacci Retracement: Identifying potential support and resistance levels
- Moving Average Crossovers: Detecting potential trend changes
Developing expertise in chart analysis is an ongoing journey. Traders should:
- Practice consistently
- Keep detailed trading journals
- Continuously learn and adapt their strategies
- Remain objective and avoid emotional decision-making
Remember that no single approach guarantees success in forex trading. The most successful traders combine technical analysis with sound risk management, continuous learning, and the ability to adapt to changing market conditions.
Ultimately, chart analysis is both an art and a science. It requires patience, discipline, and a willingness to learn from both successful trades and inevitable mistakes. By developing a systematic approach and maintaining a growth mindset, traders can improve their chart reading skills and make more informed trading decisions.
Frequently Asked Questions
What are the different types of forex charts?
The three primary types of forex charts are line charts, bar charts, and candlestick charts. Line charts connect closing prices over time, bar charts provide detailed price information including open, high, low, and close, while candlestick charts offer comprehensive market insights with color-coded candles for easier interpretation.
How do I read candlestick charts in forex trading?
Candlestick charts display price movements as colored ‘candles.’ Each candle represents a specific time period and consists of a body, which shows the range between opening and closing prices, and wicks that indicate the highest and lowest prices. Green or white candles indicate price increases, while red or black candles signify decreases.
What are key technical indicators to use with forex charts?
Key technical indicators include Moving Averages (MA), Relative Strength Index (RSI), Stochastic Oscillator, and MACD (Moving Average Convergence Divergence). These indicators help traders interpret market signals and identify potential trading opportunities based on price trends and momentum.
How can I identify reversal patterns in forex charts?
Reversal patterns signal potential changes in market trends. Key reversal patterns include Head and Shoulders, Double Tops/Bottoms, and Inverse Head and Shoulders. Traders can spot these patterns by analyzing price movements and looking for specific formations that indicate trend exhaustion or shifts in market sentiment.
Ready to Turn Chart Reading Into Real Trading Success?
Learning to interpret forex charts is just the first step. Many traders struggle to confidently spot chart patterns, apply technical indicators, or turn visual analysis into real profits. If you are feeling uncertain about using candlestick signals, trend confirmation, or advanced tools, you are not alone. At FrankFX, we understand how overwhelming it can be to move from theory to results, and we have built our platform to help traders bridge that gap.
Get instant access to daily trading signals, live mentorship, and premium TradingView charting tools that make advanced analysis simple. Start for free or join a VIP membership for hands-on guidance, real-time support, and the proven solutions you need to trade forex, indices, or crypto with confidence. Do not let hesitation hold you back. Take your next step with FrankFX now and transform your chart knowledge into trading results. Ready to see how professional traders read the markets? Explore our mentorship and see what’s possible by visiting FrankFX VIP Memberships.