Many new traders are drawn to the idea of predicting market moves just by reading price charts and spotting trends. Sounds complex and mysterious at first, right? The reality is, even beginners can identify powerful patterns that swing the odds in their favor, with tools so effective that over 70% of active traders rely on technical analysis every day. The next pages will show why simplicity often beats complexity when it comes to trading strategy.
Table of Contents
- What Is Technical Analysis In Trading?
- Key Charts And Patterns Every Beginner Should Know
- Essential Technical Indicators For Smart Trading
- How To Build A Simple Trading Strategy
Quick Summary
| Takeaway | Explanation |
|---|---|
| Understand core principles of technical analysis | Recognize that price discounts all information, trends guide movements, and history tends to repeat itself. |
| Master essential chart patterns | Learn to identify patterns like head and shoulders and triangles to anticipate market trends. |
| Utilize key technical indicators | Employ indicators like RSI and moving averages to analyze market strength and direction effectively. |
| Develop a clear trading strategy | Establish structured entry, exit, and risk management rules tailored to your market understanding. |
| Practice consistently with simplicity | Focus on straightforward strategies and continuous practice to refine your trading skills effectively. |
What Is Technical Analysis in Trading?
Traders seeking to understand market movements rely on technical analysis as a powerful method for interpreting financial data and predicting potential price trends. Unlike fundamental analysis that examines a company’s financial health, technical analysis focuses exclusively on price action and statistical market indicators.
The Core Principles of Technical Analysis
Technical analysis operates on three fundamental principles that guide traders in understanding market behavior. Investopedia explains that these principles are rooted in the idea that historical price movements and trading volumes can provide insights into future market performance.
Key principles include:
-
Price Discounts Everything: Market prices already reflect all available information, including fundamental economic factors, trader sentiment, and potential future developments. This means the current price represents a comprehensive view of all known market dynamics.
-
Price Moves in Trends: Financial markets rarely move in random patterns. Instead, prices tend to follow identifiable trends – upward, downward, or sideways – which technical analysts can recognize and potentially leverage for trading decisions.
-
History Tends to Repeat: Human psychology remains consistent in financial markets. Traders often react similarly to comparable market situations, creating recognizable patterns that can be studied and predicted.
Tools and Indicators in Technical Analysis
Traders utilize various tools and indicators to interpret market data. Corporate Finance Institute highlights several critical techniques that help traders understand market movements and potential future directions.
These tools include:
Charting Techniques:
- Line charts
- Candlestick charts
- Bar charts
Mathematical Indicators:
- Moving averages
- Relative strength index (RSI)
- Bollinger Bands
- MACD (Moving Average Convergence Divergence)
Each indicator provides unique insights into market momentum, trend strength, and potential reversal points. Successful technical analysis involves combining multiple indicators to create a comprehensive market view.
Technical analysis transforms raw market data into actionable trading strategies. By understanding price patterns, volume trends, and statistical indicators, traders can make more informed decisions about entry and exit points in various financial markets, including stocks, forex, and cryptocurrencies.
While technical analysis is a powerful tool, it is not infallible. Smart traders combine technical analysis with fundamental research, risk management strategies, and continuous learning to develop robust trading approaches.
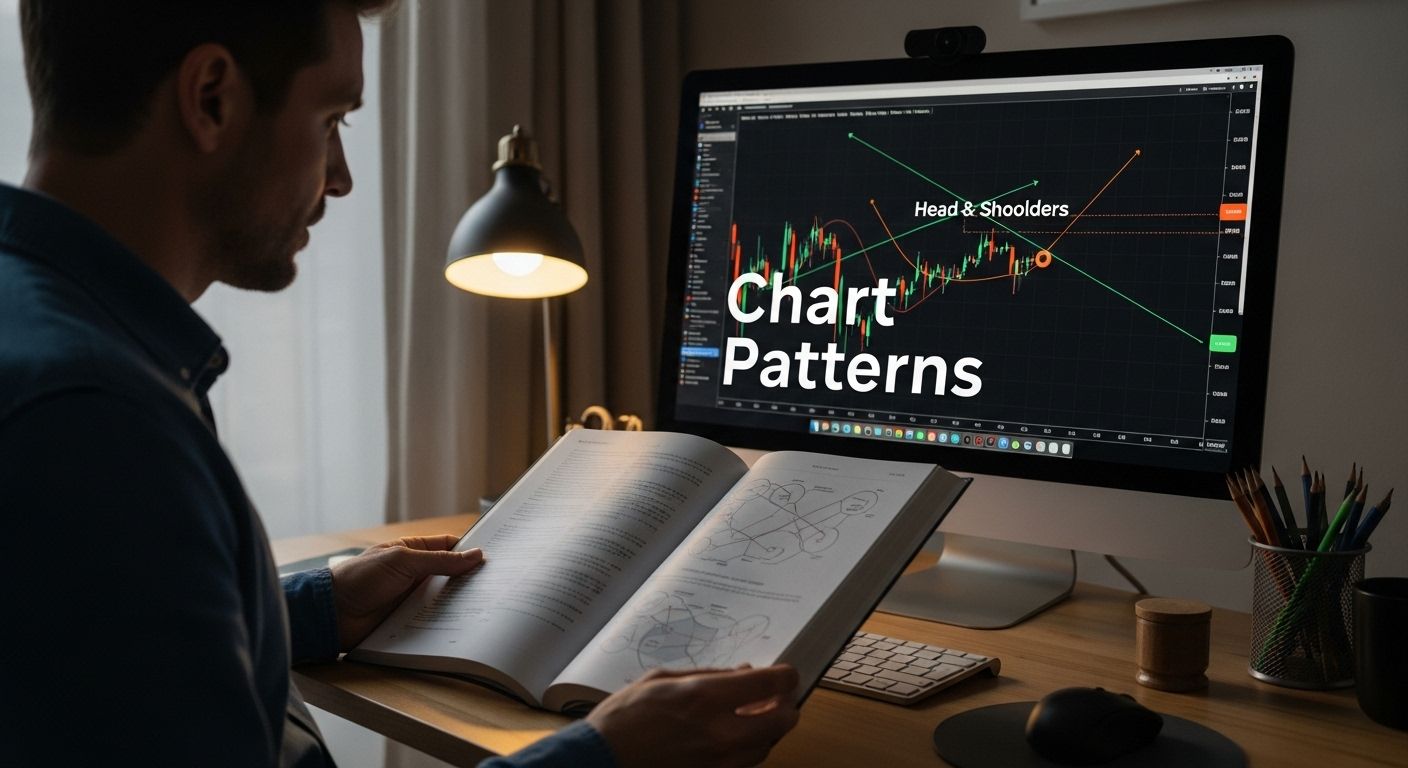
Key Charts and Patterns Every Beginner Should Know
Understanding chart patterns is crucial for traders using technical analysis. These visual representations help traders predict potential market movements by recognizing recurring geometric shapes and price formations that signal possible trend continuations or reversals.
Fundamental Chart Pattern Categories
Chart patterns are typically divided into two primary categories that help traders interpret market psychology and potential price movements. TradingView highlights the importance of recognizing these distinct pattern classifications.
To help beginners quickly grasp the differences between key chart pattern categories, here is a comparison table summarizing continuation and reversal patterns, including what they suggest about market trends.
| Pattern Category | Purpose | Typical Signal |
|---|---|---|
| Continuation Pattern | Indicates trend will likely continue | Trend persistence |
| Reversal Pattern | Suggests a trend change may occur | Trend reversal |
Pattern Categories:
-
Continuation Patterns: These formations suggest the current market trend is likely to persist after a brief consolidation period. Traders use these patterns to confirm existing market momentum and plan strategic entry points.
-
Reversal Patterns: These chart formations indicate a potential trend change, signaling that the current price direction might soon shift. Recognizing these patterns helps traders anticipate and prepare for significant market trend transformations.
Essential Chart Patterns for Beginners
Several key chart patterns provide valuable insights for traders at all experience levels. Corporate Finance Institute recommends mastering these fundamental visual indicators:
Bullish Patterns:
- Head and Shoulders (Inverse): A pattern showing potential upward price movement after a downtrend
- Ascending Triangle: Indicates potential continued upward price momentum
- Cup and Handle: Suggests a potential bullish breakout after a consolidation period
Bearish Patterns:
- Head and Shoulders: Signals potential downward price movement
- Descending Triangle: Indicates potential downward price trend
- Double Top: Suggests a potential trend reversal from bullish to bearish
Neutral Patterns:
- Symmetrical Triangle: Indicates potential price movement in either direction
- Rectangle: Represents a period of price consolidation
Successful pattern recognition requires practice and careful observation. Each pattern provides a snapshot of market psychology, representing the collective trading decisions of market participants. While these patterns offer valuable insights, they are not guaranteed predictors of future price movements.
Traders should combine pattern recognition with other technical analysis tools, risk management strategies, and a comprehensive understanding of market dynamics. Learning to identify these patterns takes time and consistent practice. Beginners are encouraged to study historical charts, use paper trading platforms, and gradually develop their pattern recognition skills.
Remember that no single chart pattern guarantees absolute market prediction. Technical analysis is a probabilistic approach that requires continuous learning, adaptability, and a nuanced understanding of market complexities.
Essential Technical Indicators for Smart Trading
Technical indicators are mathematical calculations based on historical price, volume, and open interest data that help traders analyze market trends and make informed trading decisions. Investopedia defines these tools as critical components in developing comprehensive trading strategies.
Categories of Technical Indicators
Traders utilize different types of technical indicators to gain insights into market behavior. Britannica highlights three primary categories that provide unique perspectives on market dynamics:
Indicator Types:
- Trend-Following Indicators: Help identify and confirm existing market trends, allowing traders to understand overall market direction
- Momentum Indicators: Measure the speed and strength of price movements, signaling potential trend reversals
- Volatility Indicators: Assess market fluctuations and potential price range expansions or contractions
Key Technical Indicators Every Trader Should Know
Several technical indicators stand out as essential tools for traders across different markets. Investopedia recommends mastering these fundamental analytical tools:
Trend Indicators:
- Moving Averages: Smooth out price data to create a single flowing line, helping identify overall trend direction
- Moving Average Convergence Divergence (MACD): Reveals changes in strength, direction, momentum, and duration of a trend
Momentum Indicators:
- Relative Strength Index (RSI): Measures the magnitude of recent price changes to evaluate overbought or oversold conditions
- Stochastic Oscillator: Compares a closing price to its range over a specific period, indicating potential trend reversals
Volatility Indicators:
- Bollinger Bands: Show price volatility by creating a band around the moving average
- Average True Range (ATR): Measures market volatility by decomposing the entire range of an asset price
Effective use of technical indicators requires understanding their limitations. No single indicator provides a guaranteed prediction of future market movements. Successful traders combine multiple indicators, considering their unique strengths and potential weaknesses.
Beginners should start by mastering a few key indicators, practicing their application through paper trading or demo accounts. Developing intuition takes time and consistent practice. Traders must learn to interpret these indicators in context, understanding that they are tools for analysis, not infallible prophecies of market behavior.
Risk management remains crucial. Technical indicators should be part of a broader trading strategy that includes fundamental analysis, risk assessment, and a disciplined approach to market participation. Continuous learning and adaptability are the hallmarks of successful traders who effectively utilize technical indicators.
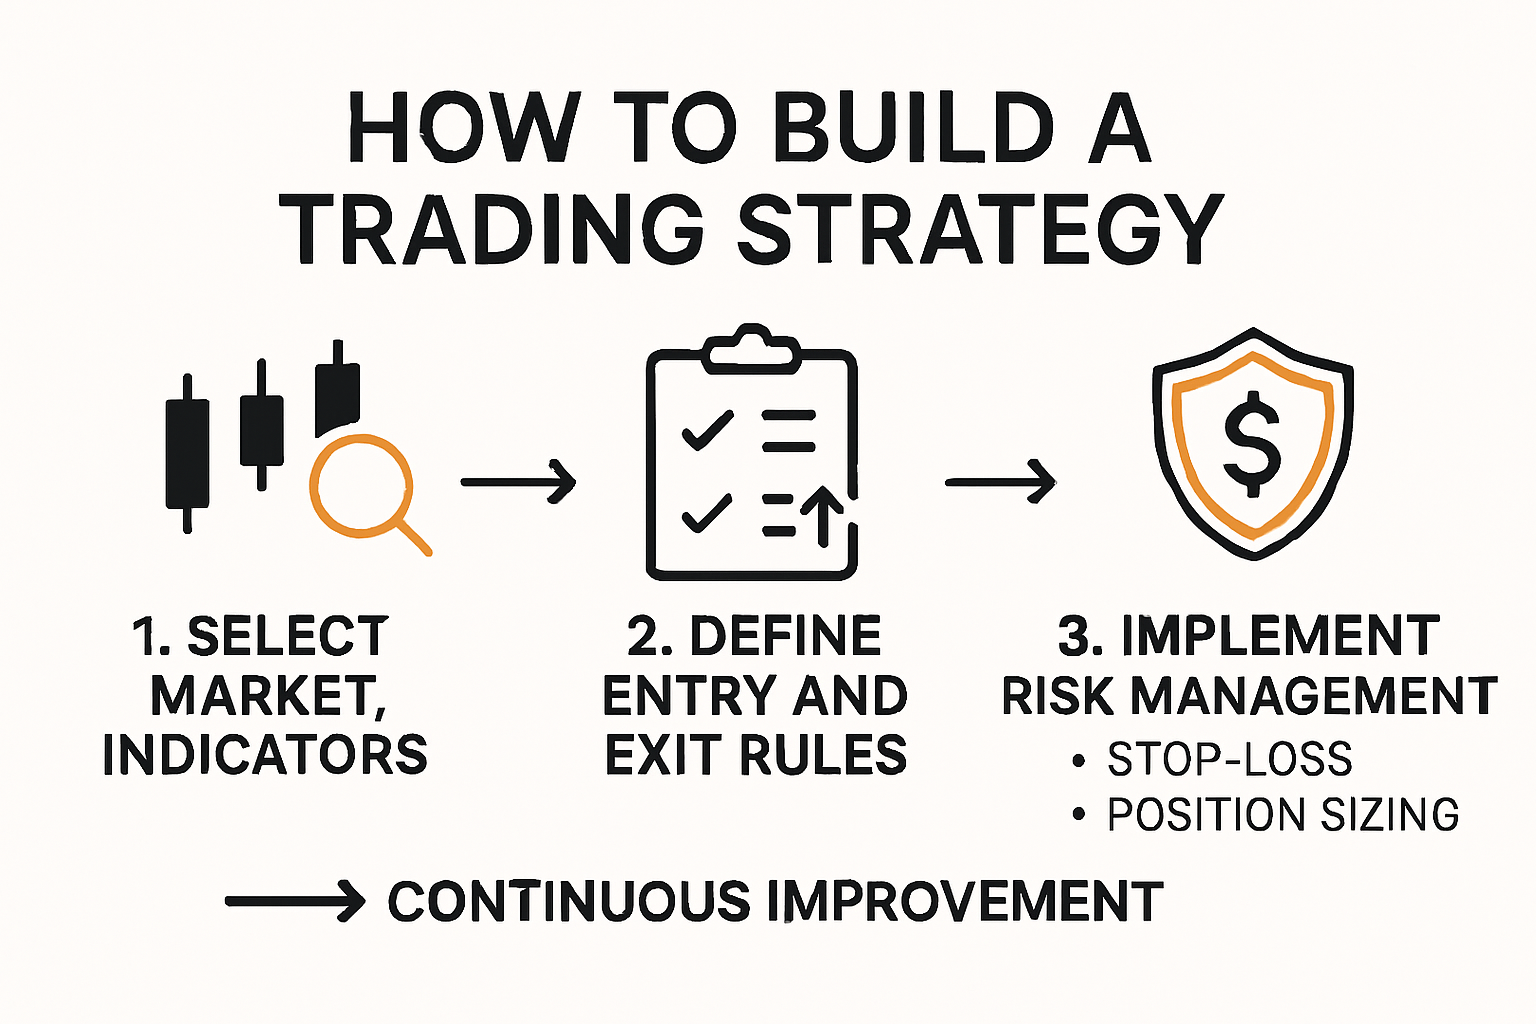
How to Build a Simple Trading Strategy
Developing a trading strategy is a systematic process that transforms technical analysis knowledge into actionable trading decisions. Corporate Finance Institute emphasizes that a well-constructed strategy provides traders with a structured approach to market participation.
Foundational Strategy Components
A robust trading strategy requires several critical elements that work together to guide trading decisions. Investopedia highlights the key components that form the backbone of an effective trading approach:
Essential Strategy Elements:
- Clear Entry and Exit Rules: Precise conditions for initiating and closing trades
- Risk Management Parameters: Predetermined methods for controlling potential losses
- Position Sizing Guidelines: Consistent approach to determining trade volume
- Market Selection Criteria: Specific markets or assets that align with your strategy
Step-by-Step Strategy Development Process
Building a trading strategy involves a methodical approach to identifying and capitalizing on market opportunities. Investopedia outlines a comprehensive process for strategy creation:
Strategy Development Steps:
Below is a process table outlining the key stages of developing a simple trading strategy as described in the article. This makes it easy to follow each step in sequence.
| Step | Key Actions/Details |
|---|---|
| 1. Market & Indicator Selection | Choose markets & 2-3 indicators; focus on what you understand |
| 2. Define Entry Conditions | Identify trade triggers (e.g., moving average crossover); seek confirmation |
| 3. Establish Exit Rules | Set profit targets/loss limits; use stop-loss & take-profit orders |
| 4. Risk Management | Risk 1-2% per trade; ensure position sizing & risk-reward ratios |
- Market and Indicator Selection
- Choose specific markets (forex, stocks, cryptocurrencies)
- Select 2-3 complementary technical indicators
- Focus on markets you understand deeply
- Define Entry Conditions
- Identify specific trigger points for trades
- Example: Moving average crossover
- Combine multiple indicators for confirmation
- Establish Exit Rules
- Set clear profit targets
- Define maximum acceptable loss
- Use stop-loss and take-profit orders
- Risk Management
- Never risk more than 1-2% of total trading capital per trade
- Use position sizing to control potential losses
- Implement consistent risk-reward ratios
Successful strategy development requires continuous refinement. Traders should backtest their strategies using historical data, practice on demo accounts, and maintain detailed trading journals to track performance and identify improvement areas.
Beginners often make the mistake of creating overly complex strategies. The most effective approaches are typically simple, consistent, and easy to implement. Focus on developing a strategy that matches your risk tolerance, time commitment, and market understanding.
Remember that no strategy guarantees consistent profits. Markets are dynamic, and successful trading demands adaptability, continuous learning, and emotional discipline. Treat your trading strategy as a living document that evolves with your experience and market conditions.
Frequently Asked Questions
What is Technical Analysis in Trading?
Technical analysis is a method used by traders to interpret financial data and predict potential price trends by focusing exclusively on price action and market indicators, rather than a company’s financial health.
What are the core principles of Technical Analysis?
The core principles include the ideas that price discounts all information, price moves in trends, and historical price movements tend to repeat themselves.
How do I identify key chart patterns as a beginner?
Beginners should learn to recognize essential patterns such as head and shoulders, triangles, and double tops. Practicing on historical charts and using paper trading can help develop this skill.
What are some essential technical indicators for trading?
Key technical indicators include Moving Averages, Relative Strength Index (RSI), and Bollinger Bands. These indicators provide insights into market trends, momentum, and volatility, helping traders make informed decisions.
Ready to Turn Technical Analysis Into Real Results?
You have just learned the essentials of chart patterns, technical indicators, and simple strategies designed for beginners. But moving from theory to real-world trading can feel overwhelming. Many new traders struggle with building confidence, understanding entry and exit signals, or finding reliable mentorship and live support.

Now is your chance to bridge the gap between knowledge and success. Explore FrankFX to access hands-on guidance, daily trading signals, live mentorship, and advanced analysis sessions. Sign up for our free tools and discover how our forex calculators and trading indicators can help you apply strategies you just learned. Join a thriving community that supports your growth every step of the way. Take control of your trading journey today