Successful trading often seems like a mystery, especially when the markets move with such speed and uncertainty. Yet most profitable traders rely on simple principles like reading support and resistance levels, not elaborate secrets. Get this. Professional traders validate support and resistance levels by looking for at least three price touch points before placing trades. Most beginners never even notice these chart patterns. That means the real edge comes from mastering these basics, not complicating your approach—and it could completely change the way you see every price chart from now on.
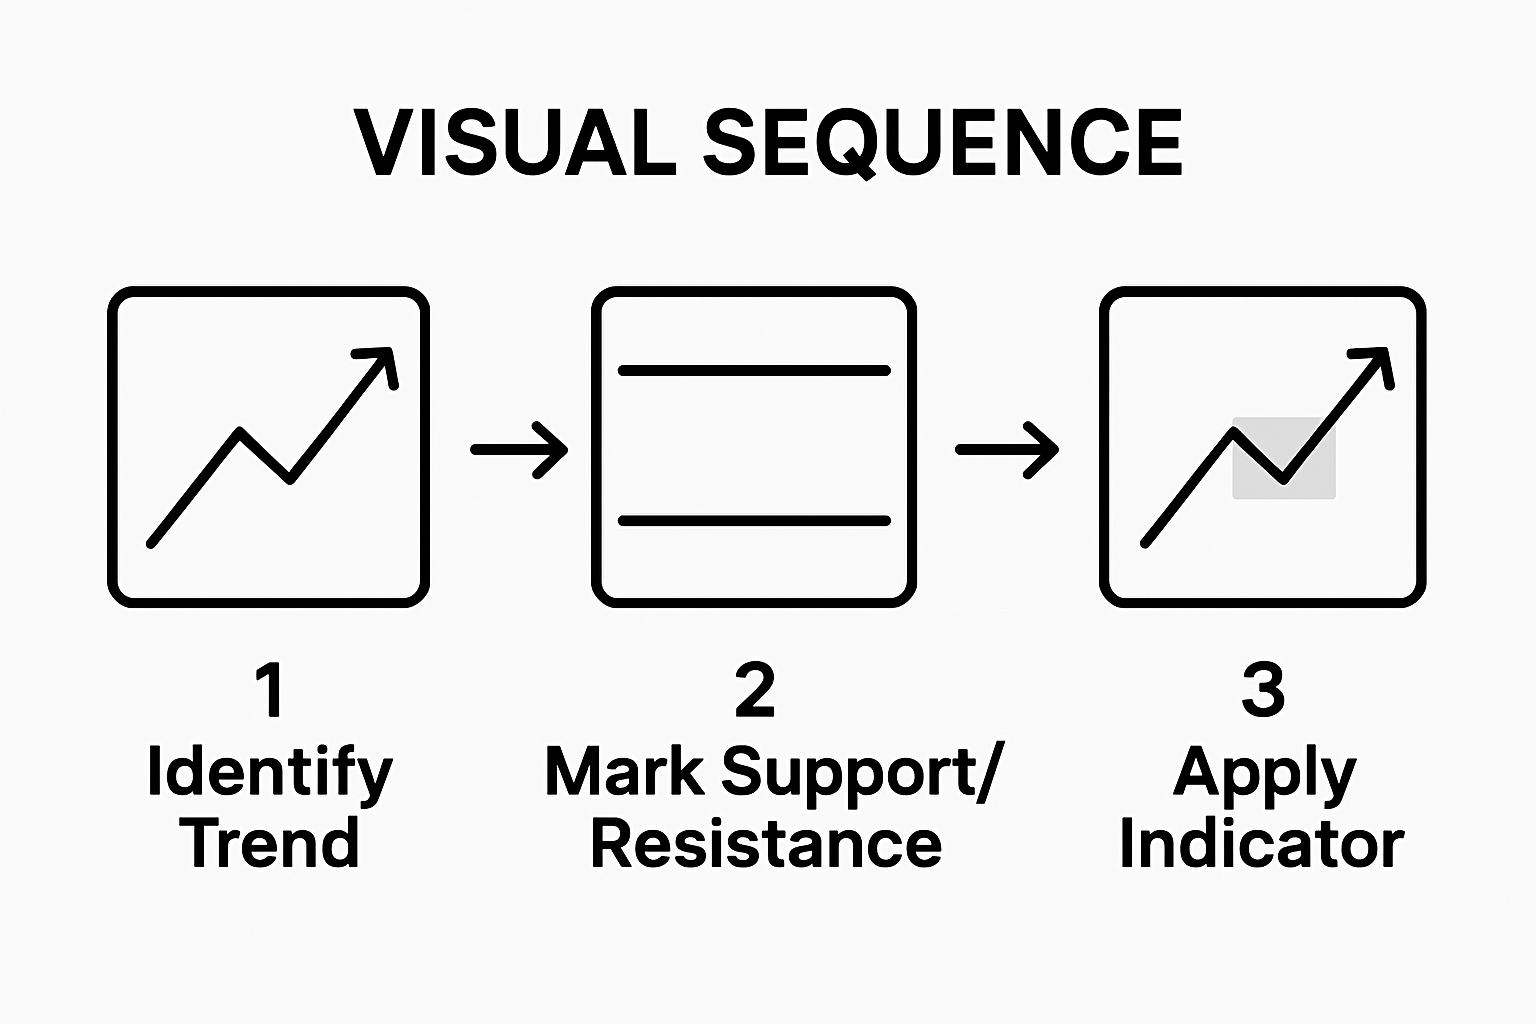
Below is a step overview table summarizing the main actions required to master the support and resistance indicator. Each step includes the key objective and the typical difficulty level for beginners.
| Step | Key Objective | Difficulty Level |
|---|---|---|
| 1. Identify Market Trends | Recognize uptrends, downtrends, and consolidation zones using price charts | Moderate |
| 2. Locate Key Levels | Spot areas where price repeatedly bounces or rejects (support/resistance) | Moderate |
| 3. Apply Indicator | Add and configure support/resistance indicator on your charting platform | Easy |
| 4. Analyze Price Action | Interpret price behavior and signals around key levels | Challenging |
| 5. Test with Demo Account | Validate strategy risk-free and track your results | Easy |
| 6. Review & Adjust | Regularly evaluate performance and fine-tune your approach | Moderate |
Table of Contents
- Step 1: Identify Market Trends Using Price Charts
- Step 2: Locate Key Support and Resistance Levels
- Step 3: Apply the Support and Resistance Indicator to Your Chart
- Step 4: Analyze Price Action and Signals Generated
- Step 5: Test Your Strategy with a Demo Account
- Step 6: Review and Adjust Your Approach Regularly
Quick Summary
| Key Point | Explanation |
|---|---|
| 1. Identify market trends through price charts | Use multiple timeframes to evaluate price action, focusing on uptrends, downtrends, and sideways trends for better trading insight. |
| 2. Locate critical support and resistance levels | Analyze historical price charts to find areas where price action frequently bounces or reverses, indicating key psychological barriers. |
| 3. Apply support and resistance indicators effectively | Configure indicators on multiple timeframes to improve accuracy, ensuring they align with manually identified key price levels. |
| 4. Analyze price action for trading signals | Watch for interactions with support and resistance levels, noting bounce, break, or consolidation patterns for potential trading opportunities. |
| 5. Regularly review and adjust your strategy | Conduct periodic performance reviews, focusing on win rates and trade outcomes, to refine and improve your trading methodology. |
Step 1: Identify Market Trends Using Price Charts
Understanding market trends forms the critical foundation for successful trading using the support and resistance indicator. Price charts serve as your primary visual roadmap, revealing crucial information about market momentum, direction, and potential future movements. Before diving into specific indicator techniques, you must develop a keen eye for interpreting price action and recognizing underlying market trends.
To effectively identify market trends, start by selecting a robust charting platform with comprehensive analytical tools. TradingView provides an excellent starting point for traders at all levels. Begin by examining multiple timeframes to gain a comprehensive perspective of price behavior. Professional traders recommend reviewing daily, weekly, and monthly charts to understand both short term and long term trend characteristics.
When analyzing price charts, focus on three primary trend directions: uptrend, downtrend, and sideways (or consolidation) trends. In an uptrend, prices create progressively higher highs and higher lows, indicating bullish market sentiment. Conversely, a downtrend demonstrates lower highs and lower lows, signaling bearish market conditions. Sideways trends represent periods of price consolidation where the market lacks clear directional momentum.
Pay close attention to key price levels where significant market movements have historically occurred. These areas represent potential support and resistance zones that can provide critical insights into future price action.
Look for repeated price rejections at specific levels, which often indicate strong psychological barriers in the market.
Learn more about advanced technical analysis in our comprehensive trading strategy guide.
Verify your trend identification by confirming that your observations align with at least two different technical indicators. This cross-validation helps minimize subjective interpretation and increases the reliability of your market trend analysis. Remember that trend identification is both an art and a science, requiring consistent practice and refined observational skills.
Step 2: Locate Key Support and Resistance Levels
Locating key support and resistance levels represents the critical next phase in mastering technical trading strategies. These levels act as psychological price barriers where market participants consistently demonstrate buying or selling interest, creating predictable price movement patterns. Understanding how to accurately identify these zones will dramatically improve your trading precision and decision making.
To effectively locate support and resistance levels, begin by examining historical price charts and identifying areas where prices have repeatedly bounced or been rejected. Horizontal support levels represent price floors where buying pressure typically overcomes selling pressure, preventing further downward movement. Horizontal resistance levels act as price ceilings where selling pressure overwhelms buying momentum, preventing additional upward price advancement.
Utilize multiple tools and techniques to confirm your support and resistance observations. The high and low price points from previous trading periods provide excellent initial reference points. Pay special attention to price points where significant market reversals have occurred multiple times. Trading platforms like TradingView offer built in tools that can automatically highlight these critical price zones, making identification more straightforward for beginners.
Professional traders recommend using three or more touch points to validate a genuine support or resistance level. A single bounce might be coincidental, but repeated price interactions at the same level suggest a statistically significant market behavior. Look for scenarios where prices test these levels multiple times without breaking through, which indicates strong market sentiment at those specific price points.
Explore advanced breakout trading techniques to enhance your understanding of support and resistance dynamics. By developing a systematic approach to identifying these levels, you transform abstract price movements into actionable trading insights.
Verify your support and resistance level identification by confirming that your chosen levels demonstrate consistent price rejection across different timeframes. The most reliable levels will show repeated interaction points on daily, weekly, and monthly charts, providing a robust framework for your trading strategy.
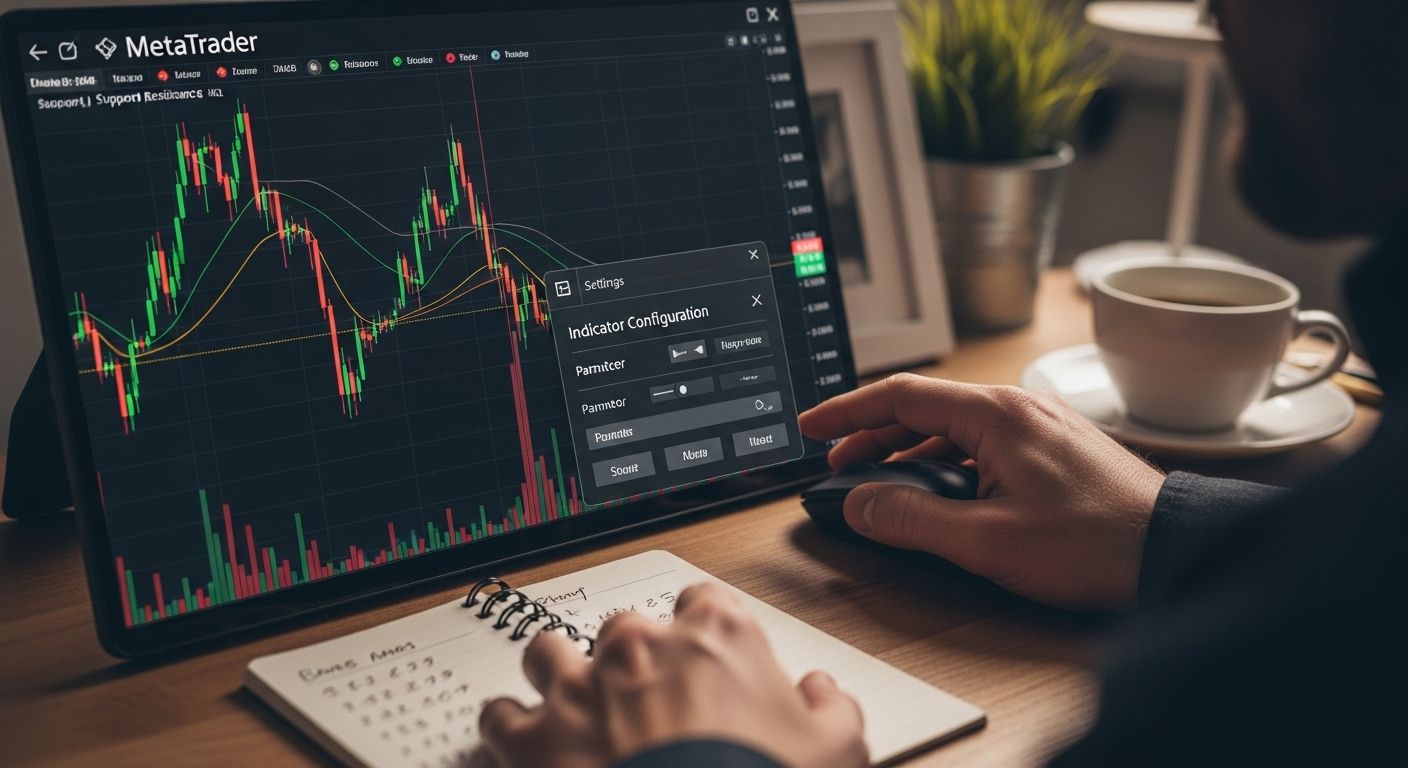
Step 3: Apply the Support and Resistance Indicator to Your Chart
Applying the support and resistance indicator represents a strategic approach to transforming raw price data into actionable trading insights. This step involves selecting the right indicator and configuring it precisely to match your specific trading strategy and market conditions. Successful application requires a combination of technical knowledge and strategic interpretation.
Begin by selecting a robust charting platform with comprehensive technical analysis tools. TradingView and MetaTrader offer excellent built in support and resistance indicators that can be customized to match various trading styles. When first applying the indicator, start with default settings and gradually adjust parameters to align with your observed market trends. Pay close attention to the indicator’s sensitivity settings, which determine how precisely it tracks potential support and resistance zones.
Professional traders recommend configging the indicator across multiple timeframes to validate its accuracy. A support or resistance level that appears consistent on daily, weekly, and monthly charts provides a more reliable trading signal than one visible only on a single timeframe. Look for indicators that allow you to customize color schemes, line thickness, and display preferences, enabling you to create a visually clear and easy to interpret chart.
Indicator configuration requires nuanced understanding. Some advanced indicators offer additional features like dynamic support and resistance levels that adapt to recent price action. These dynamic indicators can provide more responsive insights compared to static horizontal lines. Experiment with different indicator settings and observe how they perform across various market conditions, keeping detailed notes on their effectiveness.
Learn more about advanced technical analysis techniques to deepen your understanding of indicator application. The key is developing a systematic approach that combines indicator insights with your own market analysis.
Verify your indicator application by checking that the generated support and resistance levels align with the key price zones you manually identified in previous steps. Consistency between manual analysis and indicator output increases confidence in your trading strategy. Remember that no single indicator provides guaranteed results, and continuous learning and adaptation remain crucial to trading success.
Step 4: Analyze Price Action and Signals Generated
Analyzing price action and signals generated by support and resistance indicators represents the critical translation point where technical data transforms into actionable trading decisions. This step requires a systematic approach to interpreting the complex interactions between price movements and key market levels.
Price action analysis involves examining how prices interact with support and resistance zones. Watch for specific behavioral patterns that indicate potential trading opportunities. When prices approach a support or resistance level, three primary scenarios typically emerge: bounce, break, or consolidation. A bounce suggests the level is holding strong, with prices reversing direction. A break indicates potential trend continuation or reversal, while consolidation represents market uncertainty and potential upcoming volatility.
Professional traders recommend developing a structured observation method. Look for confirmation signals such as increased trading volume, candlestick patterns, and multiple timeframe alignment. Candlestick formations like hammer, engulfing, and doji patterns provide additional context about market sentiment at these critical price levels. Pay special attention to how prices interact with these levels multiple times, as repeated interactions increase the reliability of your analysis.
Quantify the strength of support and resistance levels by tracking the number of times prices have touched and respected these zones. Levels with three or more validated touch points typically represent more robust trading signals. Consider the context of broader market trends and use additional technical indicators to cross validate your observations. Momentum indicators like RSI and MACD can provide supplementary insights into potential price movements.
Explore advanced breakout trading strategies to enhance your understanding of price action dynamics. The goal is to transform raw indicator data into a comprehensive trading narrative that guides your decision making.
Verify your analysis by maintaining a trading journal documenting each signal, its context, and subsequent market movement. Successful price action analysis requires continuous learning and adaptation. Look for patterns of consistency in how prices interact with support and resistance levels across different market conditions and timeframes.
Step 5: Test Your Strategy with a Demo Account
Testing your support and resistance trading strategy with a demo account serves as the critical bridge between theoretical knowledge and practical application. This step allows you to validate your approach without risking real capital, providing a safe environment to refine your technical skills and build trading confidence.
Choose a reputable trading platform that offers a comprehensive demo account with features mirroring live market conditions. Platforms like TradingView, MetaTrader 4, and MetaTrader 5 provide realistic simulation environments that closely replicate actual trading scenarios. When setting up your demo account, use virtual funds that match the amount of capital you would realistically trade with in a live environment. This approach ensures your performance testing remains as authentic as possible.
Approach demo trading with the same discipline and strategic mindset you would apply to real trading. Implement strict trading rules that mirror professional trading practices. This means establishing clear entry and exit criteria based on your support and resistance indicator signals, maintaining consistent position sizing, and documenting every trade in a detailed trading journal. Record not just the trades executed, but also the reasoning behind each decision, including the specific support and resistance levels that triggered your trade.
Performance tracking is fundamental to strategy validation. Most demo platforms offer comprehensive reporting tools that allow you to analyze your trading performance across multiple dimensions. Look for metrics such as win rate, average profit per trade, maximum drawdown, and risk reward ratio. These statistics provide objective insights into the effectiveness of your support and resistance trading strategy. Aim to achieve consistent positive results over a minimum of 30 to 50 trades before considering transitioning to live trading.
Discover free forex trading resources to supplement your demo trading education. Remember that demo trading is a learning process designed to build your skills and confidence.
Verify your strategy’s effectiveness by establishing clear benchmark criteria. These might include maintaining a win rate above 50%, keeping losses smaller than gains, and demonstrating consistent performance across different market conditions and timeframes. Patience and meticulous analysis are key to transforming your theoretical strategy into a robust, reliable trading approach.
Step 6: Review and Adjust Your Approach Regularly
Regular review and strategic adjustment of your support and resistance trading approach represents the cornerstone of long term trading success. Markets are dynamic environments that continuously evolve, and your trading strategy must demonstrate equal flexibility to remain effective. This ongoing process of evaluation and refinement transforms your trading from a static methodology to a responsive, adaptive system.
Establish a consistent performance review schedule that allows for comprehensive strategy assessment. Professional traders recommend conducting detailed performance reviews monthly or quarterly, depending on your trading frequency. During these reviews, analyze key performance metrics including win rate, average profit per trade, maximum drawdown, and risk reward ratio. Look beyond simple numerical data and examine the underlying reasons behind your trading decisions. Identify patterns in your successful trades and understand the specific market conditions that contribute to your most profitable moments.
Develop a systematic approach to strategy modification. When reviewing your trading performance, focus on three critical adjustment areas: indicator parameter tuning, entry and exit criteria refinement, and risk management protocols. Minor adjustments to your support and resistance indicator sensitivity can significantly impact trading results. Experiment with different timeframe combinations and indicator settings, carefully documenting the impact of each modification. Be patient and make incremental changes rather than implementing radical strategy overhauls that could destabilize your entire approach.
Utilize advanced tracking tools and trading journals to maintain meticulous records of your strategy’s performance. Modern trading platforms offer sophisticated analytics that can help you visualize performance trends and identify subtle improvement opportunities. Pay special attention to how your strategy performs across different market conditions, including trending and ranging markets. Consistent performance across multiple market environments indicates a robust trading approach.
Learn more about advanced risk management techniques to complement your strategy review process. Remember that successful trading is a continuous learning journey.
Verify your review process by establishing clear benchmark criteria for strategy modification. These might include maintaining a minimum win rate, ensuring losses remain smaller than gains, and demonstrating adaptability across various market timeframes and conditions. Approach each review with intellectual honesty, willing to acknowledge and address potential weaknesses in your trading methodology.
The following checklist table provides key verification steps mentioned in the article to help ensure each phase of your support and resistance trading approach is properly executed.
| Step | Verification Checklist | How to Confirm |
|---|---|---|
| Trend Identification | Observations match across two technical indicators | Cross-verify on at least daily and weekly charts |
| Support/Resistance Level | Level has 3+ price touch points and appears on multiple timeframes | Compare on daily, weekly, and monthly charts |
| Indicator Application | Indicator levels align with manually identified zones | Visually check overlay on chart |
| Price Action Analysis | Signals supported by volume and candlestick patterns | Execute review before trade entry |
| Demo Account Testing | Consistent win rate and risk/reward metrics over 30+ trades | Analyze platform statistics and journal records |
| Review & Adjustment | Regular reviews with documented changes and tracked outcomes | Use spreadsheet or journal for tracking |
Ready to Turn Your Support & Resistance Knowledge Into Winning Trades?
Struggling to confidently spot real opportunities after learning about support and resistance? Many beginners know the theory but still miss out on live market profits due to hesitation, unreliable signals, or lack of trade-tested strategies. If you want to bridge the gap between understanding chart patterns and making successful trades, you need real-time guidance, proven tools, and a community that supports fast skill growth.
Unlock access to daily trade signals, step-by-step mentorship, and advanced strategy sessions with our VIP memberships at FrankFX. Ready to see real results? Start by exploring our best free forex trading resources or discover advanced breakout trading techniques. Take control of your trading future now by joining a team focused on turning traders into consistent winners. Visit FrankFX and begin your journey to trading mastery today.
Frequently Asked Questions
What is the support and resistance indicator?
The support and resistance indicator is a technical analysis tool used to identify price levels where a security tends to reverse direction, acting as barriers to price movement. It helps traders make informed decisions about entry and exit points in the market.
How can I identify key support and resistance levels?
Key support and resistance levels can be identified by analyzing historical price charts for areas where prices have previously bounced or reversed. Look for horizontal lines at price points where there are multiple touches or rejections over time.
How do I apply the support and resistance indicator on my trading chart?
To apply the support and resistance indicator, select a charting platform like TradingView, customize the indicator settings according to your trading strategy, and ensure it is applied across multiple timeframes to confirm the accuracy and reliability of the identified levels.
What should I look for when analyzing price action at support and resistance levels?
When analyzing price action at support and resistance levels, observe how prices interact with these zones. Look for patterns like bounces, breaks, or consolidations, and confirm these signals with tools like candlestick patterns and trading volume for a clearer market sentiment.
Recommended
- Breakout Trading Strategies for Forex, Crypto, and Indices 2025
- A Profitable boom and crash strategy this year 2025
- Technical Analysis for Beginners
- Technical Analysis Explained
