Price charts tell a story that many traders miss. Most people get lost in complicated indicators and crowded screens but price action trading flips that on its head. Over 70 percent of professional traders rely on raw price movements instead of complex tools. Why? Because the real truth hides in the simplest patterns—and almost nobody is looking for it there.
Table of Contents
- What Is Price Action And Its Importance In Trading?
- The Psychology Behind Price Movements
- Key Concepts: Support, Resistance, And Trends
- How Volume Affects Price Action
- Practical Applications Of Price Action In Trading Strategies
Quick Summary
| Takeaway | Explanation |
|---|---|
| Focus on Price Movements | Analyzing pure price movements helps traders make informed decisions based on market dynamics. |
| Master Support and Resistance | Understanding support and resistance levels aids in identifying potential price points for entry and exit. |
| Recognize Psychological Influences | Traders should acknowledge emotional drivers like fear and greed that can affect market behavior. |
| Utilize Volume Effectively | Analyzing trading volume validates price trends and indicates potential market shifts. |
| Develop a Trading Plan | A structured price action trading plan ensures disciplined execution and risk management for better outcomes. |
What is Price Action and Its Importance in Trading?
Price action is a foundational trading methodology that centers on analyzing raw price movements and chart patterns without relying on complex technical indicators. Traders who understand price action examine how an asset’s price changes over time, interpreting market sentiment and potential future movements through visual chart patterns and price behaviors.
Defining Price Action Trading
At its core, price action trading is about understanding market psychology through price fluctuations. Instead of using multiple technical indicators, traders focus directly on price charts, studying candlestick formations, support and resistance levels, and trend patterns. According to research from Artificial Intelligence Review, this approach allows traders to develop more intuitive and responsive trading strategies.
Key characteristics of price action trading include:
- Analyzing pure price movements without external indicator noise
- Interpreting market sentiment through visual chart patterns
- Making trading decisions based on price behavior and historical context
Why Price Action Matters for Traders
Price action provides traders with a clear, unfiltered view of market dynamics. By stripping away complex indicators, traders can make more precise decisions based on actual market movements. This approach is particularly valuable in volatile markets where traditional indicators might lag behind real-time price changes.
Traders can gain significant advantages by mastering price action, such as:
- Improved market timing and entry/exit point identification
- Enhanced understanding of market sentiment
- More responsive trading strategies
For traders looking to dive deeper into technical analysis strategies, check out our guide on trading fundamentals.
The Psychology Behind Price Movements
Trading is fundamentally a human activity driven by complex psychological mechanisms that significantly influence market behavior. Understanding these psychological dynamics helps traders interpret price movements beyond mere technical analysis, revealing the emotional undercurrents that shape financial markets.
Emotional Drivers of Market Behavior
Investors and traders are not purely rational actors but emotional beings whose decisions are heavily influenced by psychological biases. According to research from Stanford Graduate School of Business, human emotions like fear, greed, and uncertainty play critical roles in determining market trends and individual trading decisions.
Key psychological factors that impact price movements include:
- Fear of Missing Out (FOMO): Drives traders to enter markets during heightened excitement
- Loss Aversion: Tendency to avoid losses more aggressively than pursuing gains
- Herd Mentality: Following crowd behavior instead of independent analysis
Cognitive Biases in Trading
Traders frequently encounter cognitive biases that distort their perception of market conditions. These psychological mechanisms can lead to irrational decision making, causing significant deviations from expected rational behavior. Understanding these biases helps traders develop more disciplined and objective trading strategies.
The following table presents a comparison of emotional drivers and cognitive biases that impact trading decisions, highlighting how psychology shapes market outcomes.
| Factor | Type | Description | Impact on Trading |
|---|---|---|---|
| Fear of Missing Out (FOMO) | Emotional Driver | Urge to enter markets during excitement | Leads to impulsive trades, possible losses |
| Loss Aversion | Emotional Driver | Preference to avoid losses over acquiring gains | May cause traders to hold losing positions too long |
| Herd Mentality | Emotional Driver | Tendency to follow crowd behavior | Can result in market bubbles or sharp reversals |
| Confirmation Bias | Cognitive Bias | Seeking data that supports existing beliefs | Skews analysis, reduces objectivity |
| Anchoring Bias | Cognitive Bias | Heavy reliance on initial information | Limits adaptability to changing conditions |
| Recency Bias | Cognitive Bias | Overweighting recent events in decision-making | May lead to short-sighted or reactive trades |
Common cognitive biases affecting trading include:
- Confirmation bias: Seeking information that validates existing beliefs
- Anchoring bias: Over-relying on initial information when making decisions
- Recency bias: Giving excessive weight to recent market events
Learn more about developing a resilient trading mindset to overcome these psychological challenges and improve your trading performance.
Key Concepts: Support, Resistance, and Trends
Price action trading revolves around understanding three fundamental concepts: support, resistance, and trends. These interconnected elements help traders decode market movements and make informed trading decisions by revealing the underlying dynamics of price behavior.
Understanding Support and Resistance
Support and resistance are critical price levels that represent psychological barriers in market trading. According to research from the CFA Institute, these levels reflect the collective sentiment of market participants and represent points where buying or selling pressure becomes concentrated.
Key characteristics of support and resistance include:
- Support Level: A price point where buying interest prevents further price decline
- Resistance Level: A price point where selling pressure prevents further price increase
- Dynamic Nature: These levels can shift based on market sentiment and new information
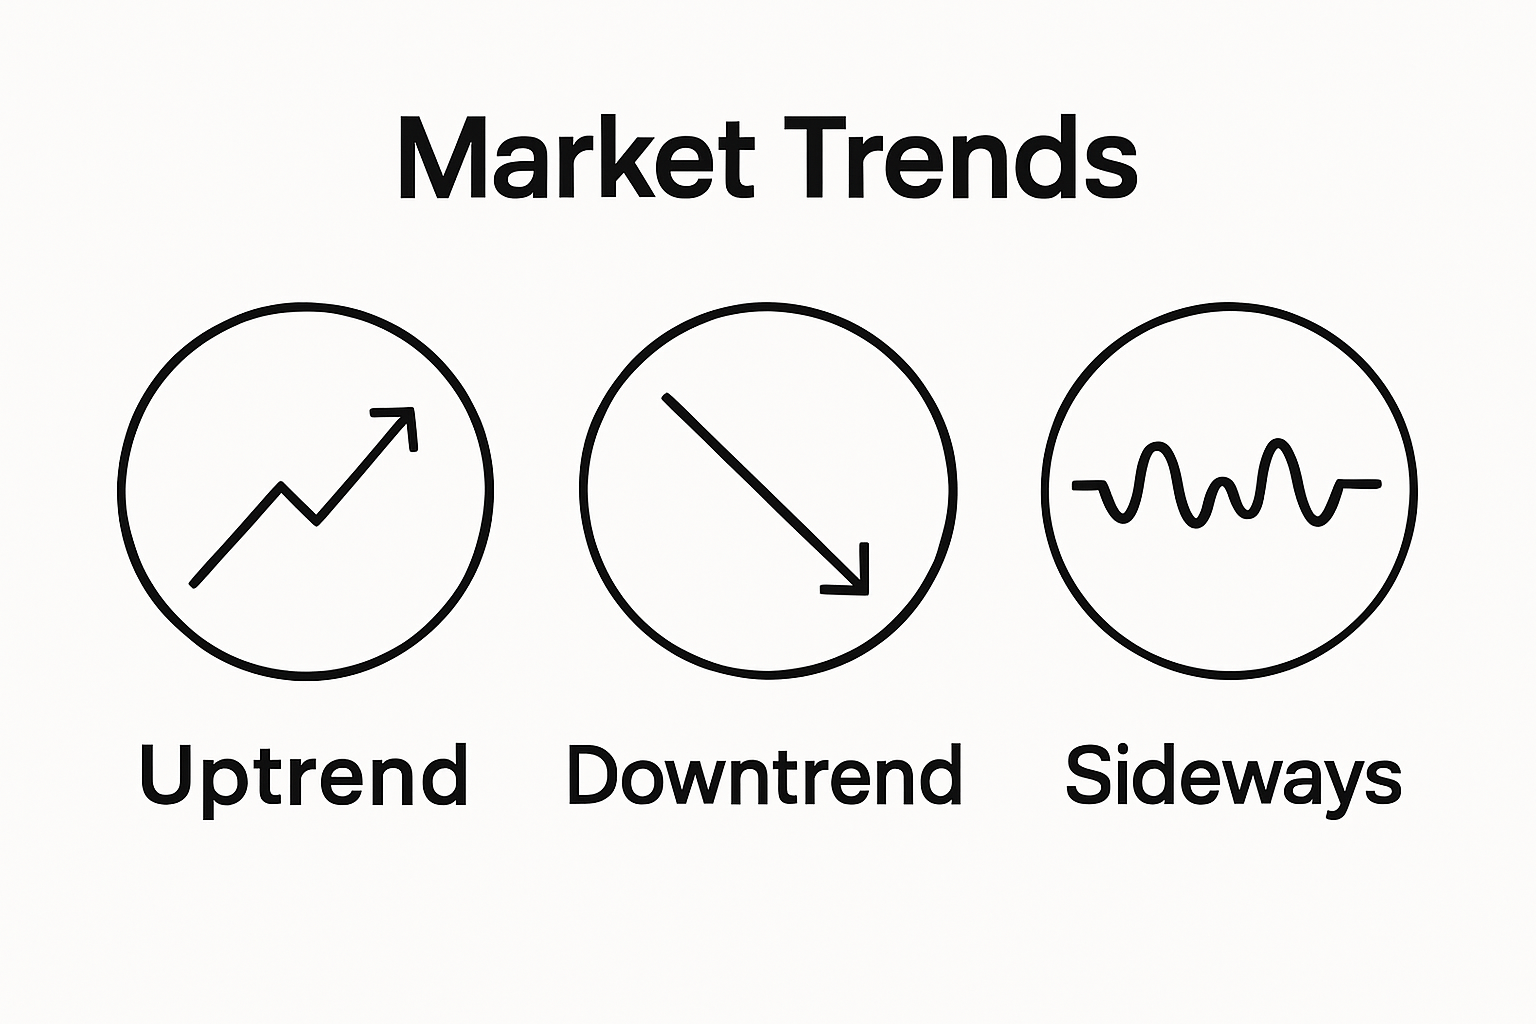
Identifying and Analyzing Market Trends
Market trends represent the overall direction of price movement over time. Traders categorize trends into three primary types: uptrends, downtrends, and sideways trends.
 By recognizing these patterns, traders can anticipate potential price movements and develop strategic trading approaches.
To clarify the core elements that price action traders focus on, the table below summarizes the definitions and characteristics of support, resistance, and market trends.
| Concept | Definition | Key Characteristics |
|---|---|---|
| Support | A price point where buying interest prevents further price decline | Represents psychological barrier; dynamic; signals potential price reversal upward |
| Resistance | A price point where selling pressure prevents further price increase | Represents psychological barrier; dynamic; signals potential price reversal downward |
| Uptrend | Overall direction where prices move higher over time | Series of higher highs and higher lows; confirmed by strong buying activity |
| Downtrend | Overall direction where prices move lower over time | Series of lower highs and lower lows; confirmed by strong selling activity |
| Sideways Trend | Prices move within a horizontal range without significant upward or downward movement | Marked by frequent reversals between support and resistance levels |

Trend identification involves analyzing:
- Price movement direction
- Duration of the trend
- Strength of price momentum
- Volume and trading activity
Explore advanced chart reading techniques to enhance your understanding of support, resistance, and trend analysis in trading.
How Volume Affects Price Action
Trading volume is a critical indicator that provides insights into the strength and potential direction of price movements. By analyzing trading volume, traders can gain deeper understanding of market dynamics and make more informed trading decisions beyond simple price observations.
Understanding Trading Volume
Trading volume represents the total number of shares or contracts traded during a specific time period. According to research from Gettysburg College, volume can be a powerful predictor of potential price changes and market sentiment.
Key aspects of trading volume include:
- Confirmation of Price Movements: High volume validates the strength of a price trend
- Potential Trend Reversals: Sudden volume spikes might indicate upcoming market shifts
- Market Participation: Reflects the level of trader interest and market engagement
Volume and Price Action Relationships
Volume acts as a critical confirmatory tool in price action analysis. Traders use volume to validate price movements, understand market momentum, and identify potential trading opportunities. Low volume during price changes might suggest weak market conviction, while high volume can indicate strong market sentiment and potential trend continuation.
Important volume analysis considerations:
- Volume preceding price breakouts
- Divergences between price and volume
- Comparative volume levels during different market phases
Explore advanced volume trading indicators to enhance your price action trading strategy.
Practical Applications of Price Action in Trading Strategies
Price action trading transforms theoretical market analysis into practical trading strategies by providing traders with structured approaches to interpreting and responding to market movements. By understanding key patterns and signals, traders can develop robust decision making frameworks that transcend traditional indicator dependent methodologies.
Identifying Trading Signals
Trading signals represent specific chart patterns and price behaviors that indicate potential market opportunities. According to research from accounting insights, effective price action strategies require precise identification of these signals and disciplined execution.
Key price action trading signals include:
- Reversal Patterns: Indicating potential trend changes
- Continuation Patterns: Suggesting ongoing market momentum
- Breakout Signals: Highlighting potential significant price movements
Developing a Price Action Trading Plan
A comprehensive price action trading plan involves systematic approach to market analysis, risk management, and trade execution. Successful traders develop strategies that incorporate multiple confirmation factors, ensuring a disciplined and methodical trading approach.
Critical components of a price action trading plan include:
- Clear entry and exit criteria
- Predetermined risk management rules
- Consistent pattern recognition techniques
- Objective trade evaluation methods
Learn more about advanced breakout trading techniques to enhance your price action trading skills and develop more sophisticated market strategies.
Ready to Master Real Price Action Trading?
Are you struggling to decode live price movements or battling information overload from too many indicators? Many traders find it tough to identify genuine support, resistance, and trend patterns—as explored in our article—especially when emotions and cognitive biases make decision-making even more challenging. At FrankFX, we transform your understanding of price action into confident trading with practical tools and education tailored for forex, index, and crypto markets.

Take your next step now. Get daily trading signals, join our live mentorship sessions, and leverage advanced analysis classes designed to sharpen your price action skills in real time. Access a wealth of free resources and automated tools that turn complex chart reading into actionable strategies. Visit FrankFX to start benefiting today, or jump into our technical analysis guide and discover how our community-driven approach can revolutionize your trading results right now.
Frequently Asked Questions
What is price action trading?
Price action trading focuses on analyzing raw price movements and chart patterns, allowing traders to interpret market sentiment and make decisions without relying on complex technical indicators.
Why is understanding price action important for traders?
Understanding price action helps traders make more informed and precise trading decisions, improve market timing, and develop responsive trading strategies based on actual market movements, especially in volatile conditions.
How do support and resistance levels influence price action?
Support and resistance levels represent psychological barriers where buying or selling pressure accumulates. These levels help traders identify potential price reversals or continuations based on market sentiment.
What role does trading volume play in price action analysis?
Trading volume indicates the strength of price movements; high volume validates trends and potential breakouts, while low volume may suggest weak market conviction. Analyzing volume helps traders understand market dynamics better.
Recommended
- How to Read Forex Charts
- Technical Analysis for Beginners
- Breakout Trading Strategies for Forex, Crypto, and Indices 2025
- Technical Analysis Explained
