Price action and trading indicators are everywhere in financial markets and traders make decisions worth millions every day using these methods. Here is something few expect. Some research shows the MACD indicator alone has a win rate below 50% on stocks, yet many still rely on it as a major signal. So what if the most powerful trading edge actually comes from combining both approaches instead of picking sides?
Table of Contents
- Defining Price Action And Indicators In Trading
- Why Price Action Vs Indicators Matters For Traders
- Key Features Of Price Action Trading
- Role Of Indicators In Market Analysis
- Comparative Benefits And Drawbacks Of Both Approaches
Quick Summary
| Takeaway | Explanation |
|---|---|
| Understand price action’s core principles | Price action focuses on market psychology and price movements without relying on indicators. |
| Leverage both price action and indicators | Combining both approaches can enhance trading strategies by utilizing their strengths and mitigating weaknesses. |
| Recognize psychological differences in trading methods | Price action traders rely on emotional intuition, while indicator users depend on mathematical models for decision-making. |
| Evaluate indicator performance under various conditions | Technical indicators may generate delayed or false signals, affecting trading accuracy depending on market conditions. |
Defining Price Action and Indicators in Trading
Trading strategies fundamentally rely on two primary approaches for market analysis: price action and technical indicators. Understanding the nuanced differences between these methods is crucial for developing a robust trading strategy.
What is Price Action?
Price action represents a trading method that focuses exclusively on analyzing the raw price movements of a financial instrument without using additional technical indicators. Traders who practice price action rely on studying candlestick patterns, support and resistance levels, trend lines, and market structure to make trading decisions.
Key characteristics of price action trading include:
- Direct observation of price movements
- Emphasis on understanding market psychology
- Minimal reliance on complex mathematical calculations
- Focus on raw price behavior and market sentiment
Understanding Technical Indicators
Technical indicators are mathematical calculations applied to historical price and volume data to predict potential future market movements. According to research analyzing market analysis techniques, indicators transform raw market data into visual signals that help traders identify trends, momentum, and potential trading opportunities.
Common types of technical indicators include:
- Momentum oscillators like Relative Strength Index (RSI)
- Moving averages that smooth price trends
- Volume-based indicators measuring market participation
- Trend-following indicators tracking market direction
Comparative Analysis
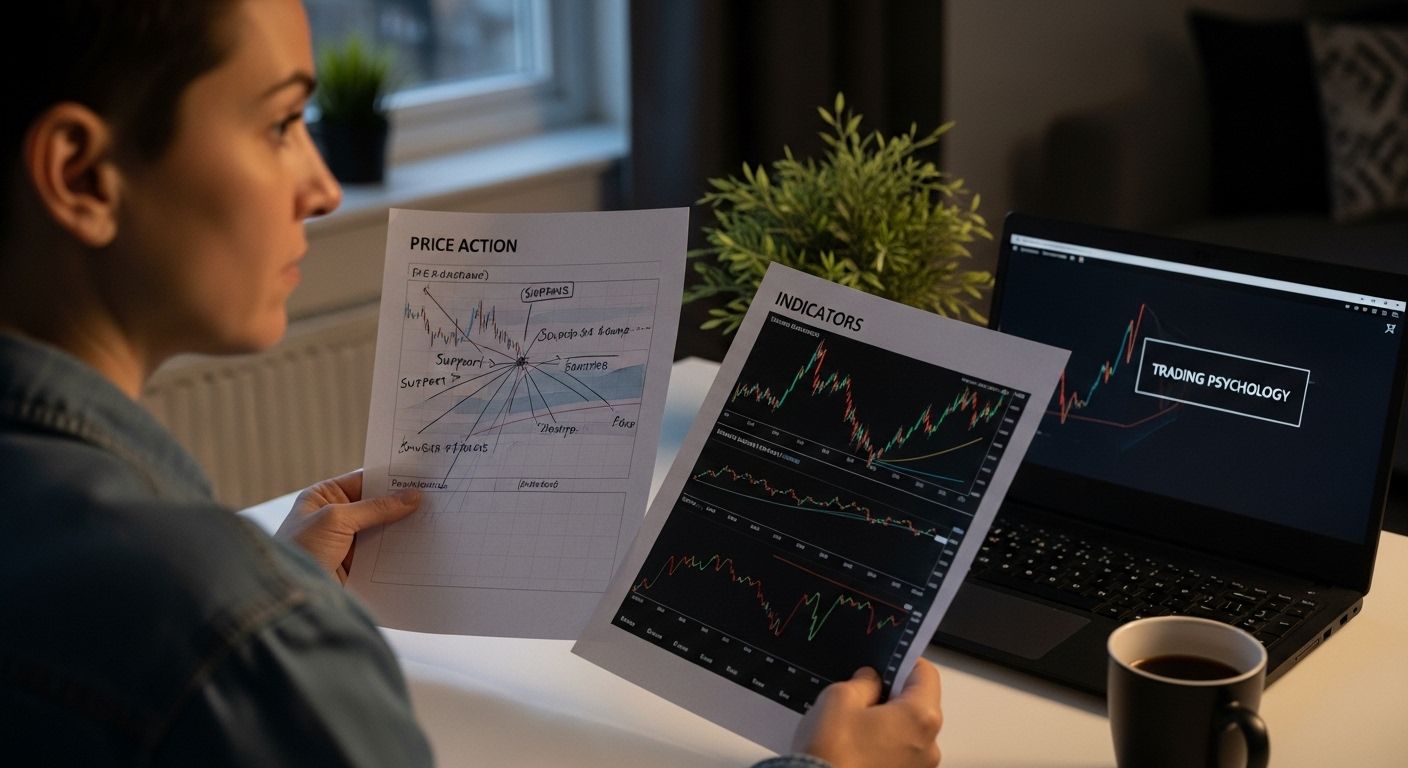
While both price action and indicators aim to provide trading insights, they differ significantly in approach. Price action traders believe in direct market interpretation, viewing price movements as the most authentic representation of market sentiment. In contrast, indicator-based traders rely on statistical computations to generate trading signals.
![]()
For traders seeking deeper market understanding, our comprehensive guide on reading forex charts offers additional insights into interpreting market movements effectively.
Why Price Action vs Indicators Matters for Traders
The ongoing debate between price action and technical indicators represents more than a methodological preference it reflects fundamental differences in trading philosophy and market interpretation. Understanding these differences can significantly impact a trader’s decision-making process and overall trading performance.
The table below compares key features, advantages, and disadvantages of price action trading and indicator-based trading, helping you quickly see their core differences and overlaps.
| Aspect | Price Action Trading | Indicator-Based Trading |
|---|---|---|
| Approach | Direct analysis of raw price movements | Mathematical analysis of historical data |
| Tools Used | Candlestick patterns, trend lines, support/resistance | Moving averages, oscillators, volume indicators |
| Focus | Market psychology and sentiment | Trend, momentum, and statistical signals |
| Complexity | Lower (visual interpretation) | Higher (requires calculations) |
| Signal Timeliness | More immediate (real-time price) | Can lag due to calculation methods |
| Psychological Orientation | Intuitive, experience-based | Systematic, rule-based |
| Main Limitation | Subjective interpretation | Possibility of delayed or false signals |
| Strategic Flexibility | Adaptable, context-driven | Often rigid without multi-indicator strategies |
Performance and Reliability Considerations
Trading strategies are ultimately judged by their ability to generate consistent profits. According to research comparing trading systems, the effectiveness of technical indicators can vary widely across different market conditions.
Key performance considerations include:
- Indicator lag and delayed signal generation
- Potential for false signal generation
- Complexity of indicator interpretation
- Market adaptability and dynamic conditions
Understanding Trading Psychology
The choice between price action and indicators reflects deeper psychological approaches to trading. Price action traders prioritize direct market observation, believing that raw price movements reveal the most authentic market sentiment. Technical indicator users, conversely, seek mathematical validation and structured signal generation.
Critical psychological differences include:
- Emotional detachment through systematic approaches
- Confidence in mathematical predictive models
- Ability to interpret market dynamics without complex calculations
- Personal comfort with different analytical methodologies
Strategic Flexibility and Market Adaptation
Traders who understand both price action and indicator-based strategies gain a significant competitive advantage. By recognizing the strengths and limitations of each approach, traders can develop more nuanced and adaptable trading strategies.
For traders interested in expanding their analytical toolkit, our beginner’s guide to technical analysis strategies provides comprehensive insights into building robust trading approaches.
Key Features of Price Action Trading
Price action trading represents a nuanced approach to market analysis that prioritizes direct observation of price movements over complex mathematical indicators. By focusing on raw price behavior, traders gain a more intuitive understanding of market dynamics and potential trading opportunities.
Core Principles of Price Action Analysis
Price action trading is grounded in the belief that historical price movements contain inherent information about future market behavior. According to historical market analysis techniques, this method emphasizes studying raw price data without relying on supplementary technical indicators.
Key principles of price action analysis include:
- Interpretation of candlestick patterns
- Recognition of support and resistance levels
- Understanding market structure and momentum
- Direct observation of price movement trends
Essential Price Action Trading Tools
Traders utilizing price action strategies employ several critical visual tools to interpret market movements. These tools help translate raw price data into actionable trading insights, allowing for more precise decision-making.
Primary price action analysis tools:
- Candlestick charts displaying precise price movements
- Trend lines identifying market direction
- Support and resistance zone mapping
- Pattern recognition techniques
Psychological and Strategic Advantages
Price action trading offers unique psychological benefits by encouraging traders to develop a more intuitive market understanding. By focusing directly on price movements, traders can reduce the complexity and potential signal noise associated with traditional technical indicators.
For traders looking to develop advanced breakout strategies that complement price action analysis, our comprehensive guide to breakout trading provides additional strategic insights into market entry and exit techniques.
Role of Indicators in Market Analysis
Technical indicators serve as sophisticated mathematical tools that transform raw market data into meaningful visual representations, enabling traders to interpret complex market dynamics and potential future movements. By converting historical price and volume information into actionable insights, indicators provide a systematic approach to understanding market behavior.
This table highlights the main types of technical indicators mentioned in the article, along with their primary function and an example for each category to support your understanding.
| Indicator Type | Primary Function | Example Indicator |
|---|---|---|
| Trend-Following | Track market direction | Moving Average |
| Momentum Oscillators | Measure rate of price change | Relative Strength Index (RSI) |
| Volume-Based | Assess market participation | On-Balance Volume (OBV) |
| Volatility | Measure market fluctuation intensity | Bollinger Bands |
Types of Technical Indicators
Technical indicators can be categorized based on their primary function and the type of market information they analyze. According to research analyzing market measurement techniques, these indicators help traders evaluate current market conditions and anticipate potential trends.
Key indicator categories include:
- Trend-following indicators tracking market direction
- Momentum oscillators measuring price change velocity
- Volume-based indicators assessing market participation
- Volatility indicators measuring market fluctuation intensity
Mathematical Foundation and Calculation
Understanding the mathematical principles behind technical indicators is crucial for effective implementation. Indicators transform raw market data through complex algorithmic calculations that consider multiple variables such as price, volume, and time intervals.
Critical mathematical considerations include:
- Weighted moving averages
- Exponential smoothing techniques
- Statistical regression models
- Algorithmic signal generation methods
Strategic Application in Trading
Successful traders view technical indicators not as standalone prediction tools but as complementary analysis instruments. By integrating multiple indicators and understanding their limitations, traders can develop more nuanced and robust trading strategies.
Traders seeking deeper insights into comprehensive technical analysis can explore our advanced technical analysis guide for more sophisticated market interpretation techniques.
Comparative Benefits and Drawbacks of Both Approaches
Trading methodologies are not one-size-fits-all solutions. Price action and technical indicators each offer unique advantages and limitations that can significantly impact trading performance and decision-making strategies. Understanding these nuanced differences allows traders to develop more sophisticated and adaptable trading approaches.
Performance and Signal Reliability
Trading performance hinges on the accuracy and timeliness of market signals. According to research comparing trading systems, pure indicator-based strategies can have significant limitations. For instance, the Moving Average Convergence Divergence (MACD) indicator alone demonstrated a win rate below 50% in stock market analysis.
Key performance considerations include:
- Signal generation accuracy
- Responsiveness to market changes
- Potential for false positive signals
- Computational complexity of analysis
Psychological and Strategic Implications
Price action and indicator approaches differ fundamentally in psychological approach. Price action traders rely on intuitive market interpretation, while indicator users seek mathematical validation. This psychological divergence affects risk management, emotional trading responses, and overall strategic decision-making.
Psychological trading differences:
- Emotional detachment levels
- Complexity of market interpretation
- Confidence in analytical methods
- Personal trading style compatibility
Integrated Trading Strategies
Advanced traders increasingly recognize that combining price action and indicator approaches can create more robust trading strategies. By leveraging the strengths of both methodologies, traders can develop more comprehensive market analysis techniques.
Traders seeking to refine their multi-dimensional trading approach can explore advanced trading strategy insights to understand how different trading techniques can be integrated effectively.
Ready to Stop Second-Guessing Your Trading Methods?
Torn between price action and indicator-based strategies? If you have struggled with false signals, analysis paralysis, or simply feeling unsure which trading method truly fits your style, you are not alone. The challenges of interpreting raw market movements or relying on lagging indicators can cause real frustration. Our article highlighted the need for clarity and confidence—whether you prefer reading price charts directly or trusting in the calculated signals from technical tools, making the right choice can shape your trading results.

With FrankFX you get everything you need to move beyond confusion and build a trading strategy that works for you. We offer expert mentorship, live trading sessions, daily signals, and both free and premium tools for forex and index markets. Discover advanced analysis with our premium solutions, learn to trade with confidence, and access a community of traders ready to help you succeed. Take the next step and explore our resources for smarter trading. Elevate your trading today and turn uncertainty into a proven advantage—visit FrankFX now and unlock your full trading potential.
Frequently Asked Questions
What is price action trading?
Price action trading is a method that focuses on analyzing the raw price movements of a financial instrument without using additional technical indicators. It involves studying candlestick patterns, support and resistance levels, and market structure to make trading decisions.
How do technical indicators work in trading?
Technical indicators are mathematical calculations applied to historical price and volume data to predict potential future market movements. They help traders identify trends, momentum, and possible trading opportunities by transforming raw market data into visual signals.
What are the advantages of using price action over indicators?
The advantages of using price action include direct observation of market behavior, reduced complexity, and a more intuitive understanding of market dynamics. Price action traders often feel more connected to market psychology without relying on complicated calculations.
Can I combine price action and technical indicators in my trading strategy?
Yes, many advanced traders successfully combine both price action and technical indicators in their trading strategies. This integrated approach allows traders to leverage the strengths of both methodologies for more nuanced market analysis and decision-making.
Recommended
- How to Read Forex Charts
- Technical Analysis for Beginners
- Technical Analysis Explained
- The Different Types of Boom and Crash Analysis
