Traders are always searching for that one indicator that can cut through market noise and reveal real momentum shifts. Surprise—while countless tools flood the trading world, the Moving Average Convergence Divergence, known as MACD, has stood the test of time for over four decades. What truly shocks is that MACD’s unique formula, blending a 12-period and 26-period exponential moving average, became a global favorite because it often pinpoints trend reversals more clearly than traditional methods.
Table of Contents
- What Is Macd And Why Is It Important In Trading?
- The Key Components Of Macd Explained
- How Macd Signals Help Traders Make Decisions
- Real-World Applications Of Macd In Different Markets
Quick Summary
| Takeaway | Explanation |
|---|---|
| MACD identifies trend direction | MACD reveals trends by comparing short-term and long-term moving averages in price movements. |
| Crossover signals indicate momentum shifts | Bullish or bearish crossovers between the MACD line and signal line inform traders of potential buying or selling opportunities. |
| Divergence signals show market reversals | Divergences between price movement and the MACD line can indicate potential trend reversals, prompting traders to reassess positions. |
| Overbought/oversold conditions are detectable | The MACD histogram helps traders identify market extremes, guiding them on when to consider entering or exiting trades. |
| Effective across multiple markets | MACD is versatile and can be used in stock, forex, crypto, and commodity markets for strategic trading decisions. |
What is MACD and Why is it Important in Trading?
Traders searching for a powerful momentum indicator often turn to the Moving Average Convergence Divergence (MACD). This technical analysis tool helps traders identify trend direction, momentum shifts, and potential trading opportunities across various financial markets.
Understanding the MACD Indicator
The MACD is a trend-following momentum indicator that reveals the relationship between two moving averages of an asset’s price. Developed by Gerald Appel in the late 1970s, this versatile tool calculates the difference between a 12-period and 26-period exponential moving average (EMA), creating a dynamic visual representation of market momentum.
Key components of the MACD include:
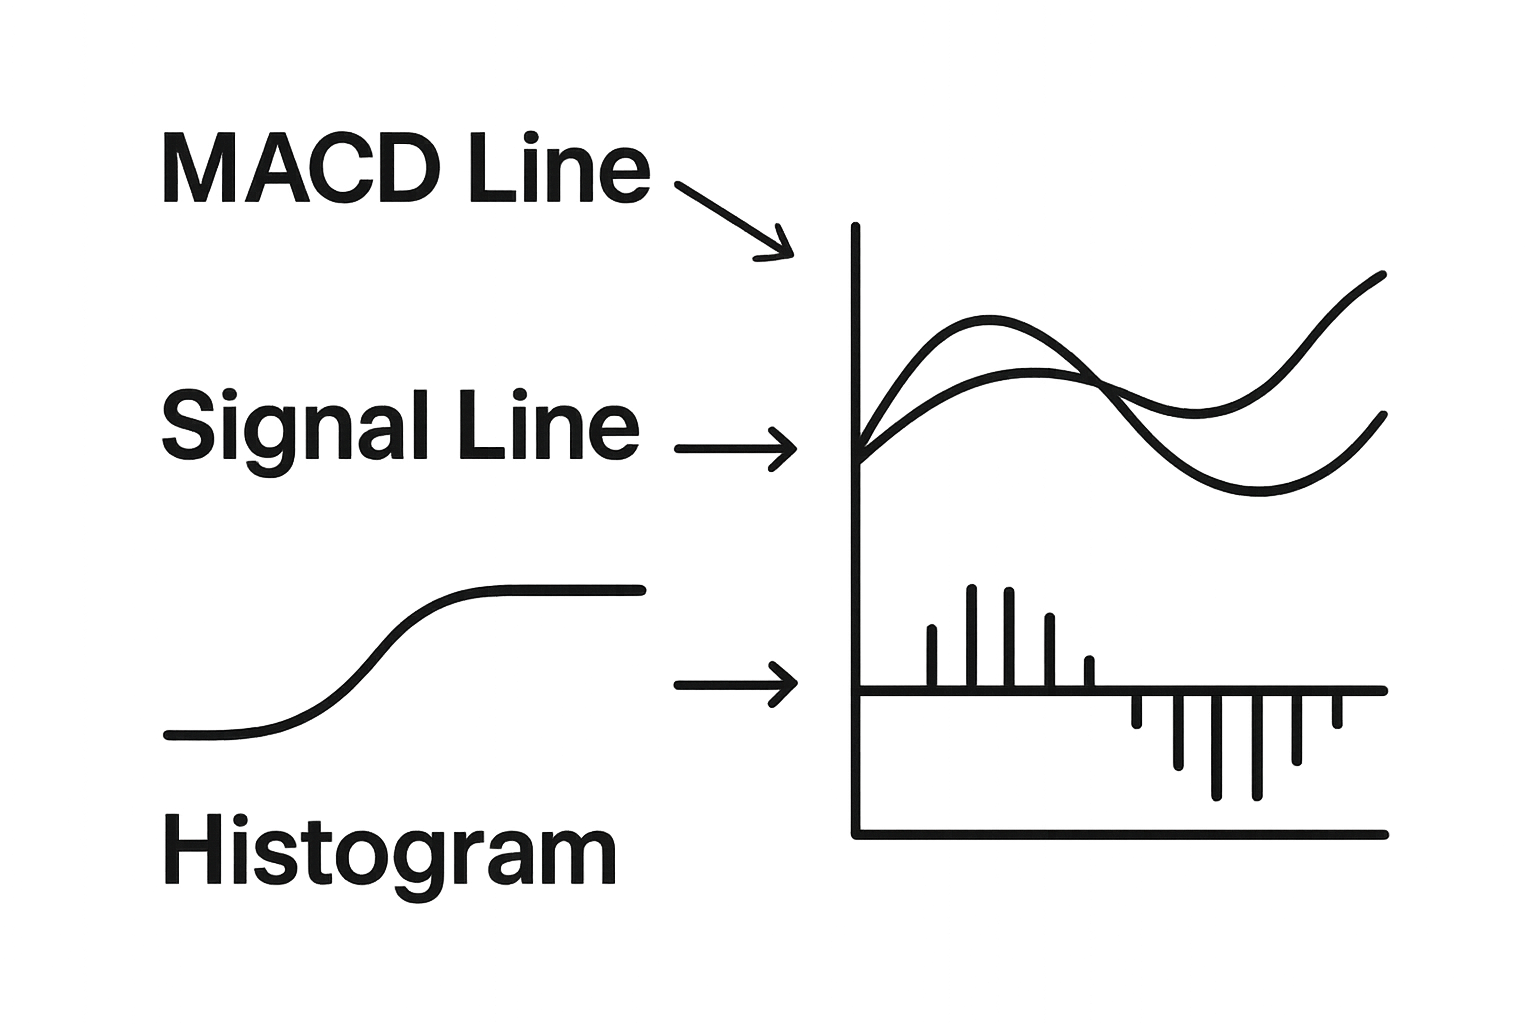
- MACD Line: The difference between the 12-period and 26-period exponential moving averages
- Signal Line: A 9-period EMA of the MACD line
- MACD Histogram: The visual representation of the difference between the MACD line and signal line
Why Traders Rely on MACD
According to research from the International Journal of Financial Studies, the MACD is particularly effective for identifying potential trend reversals and momentum changes. Traders appreciate this indicator because it provides multiple signals:
- Crossover signals indicating potential trend changes
- Divergence signals highlighting potential momentum shifts
- Overbought or oversold market conditions
By analyzing the interaction between the MACD line and signal line, traders can make more informed decisions about entry and exit points. For instance, when the MACD line crosses above the signal line, it suggests a bullish momentum, while a crossing below indicates potential bearish momentum.
For traders looking to dive deeper into technical analysis tools, check out our advanced MACD indicator guide to enhance your trading strategy.
The Key Components of MACD Explained
Traders seeking to understand the MACD indicator must first grasp its fundamental components. These elements work together to provide comprehensive insights into market momentum and potential trend changes.
Breaking Down the MACD Line
The MACD line serves as the foundation of this technical analysis tool. It represents the difference between two exponential moving averages (EMAs) – typically the 12-period and 26-period EMAs calculated from an asset’s closing prices. By comparing these two moving averages, traders gain a dynamic view of short-term and medium-term price momentum.

Key characteristics of the MACD line include:
- Calculated by subtracting the 26-period EMA from the 12-period EMA
- Reflects the speed and direction of price movements
- Helps identify potential trend changes and momentum shifts
Signal Line and Histogram Dynamics
According to technical analysis research, the signal line and histogram are crucial for interpreting MACD signals. The signal line is a 9-period EMA of the MACD line itself, acting as a trigger mechanism for potential trading decisions. The MACD histogram visually represents the relationship between the MACD line and signal line, showing the difference between these two moving averages.
Important signal interpretations include:
- Bullish Signal: When the MACD line crosses above the signal line
- Bearish Signal: When the MACD line crosses below the signal line
- Divergence Signals: When price movement differs from MACD line direction
Practical Application of MACD Components
Understanding these components allows traders to develop more nuanced trading strategies. The interaction between the MACD line, signal line, and histogram provides multiple layers of market analysis. Traders can identify potential trend reversals, momentum changes, and overbought or oversold conditions.
To clarify the unique roles each MACD component plays in market analysis, the table below breaks down their definitions and core functions.
| Component | Definition | Primary Function |
|---|---|---|
| MACD Line | Difference between 12-period and 26-period EMAs | Reveals speed and direction of price momentum |
| Signal Line | 9-period EMA of the MACD line | Acts as trigger for buy/sell decisions |
| MACD Histogram | Visual difference between MACD line and signal line | Shows strength and duration of momentum changes |
| Bullish Crossover | MACD line crosses above the signal line | Indicates potential upward (bullish) market momentum |
| Bearish Crossover | MACD line crosses below the signal line | Indicates potential downward (bearish) market momentum |
| Divergence Signal | Price moves contrary to MACD line direction | Warns of possible trend reversal or weakening momentum |
Explore our advanced MACD indicator tools to enhance your technical analysis skills and develop more sophisticated trading approaches.
How MACD Signals Help Traders Make Decisions
Traders rely on MACD signals as a sophisticated method for interpreting market momentum and identifying potential trading opportunities. This powerful technical analysis tool transforms complex price movements into actionable insights that guide strategic decision making.
Understanding MACD Trading Signals
MACD signals emerge through three primary mechanisms: crossovers, divergences, and dramatic histogram changes. These signals provide traders with nuanced information about potential trend reversals and momentum shifts in financial markets.
Key signal types include:
- Bullish Crossover: When the MACD line crosses above the signal line
- Bearish Crossover: When the MACD line crosses below the signal line
- Divergence Signals: When price movement contradicts MACD line direction
Interpreting Signal Strength and Reliability
According to advanced technical analysis research, the reliability of MACD signals depends on multiple factors. Traders must consider the context of market conditions, look for confirmation from other indicators, and assess the overall trend before making trading decisions.
Important considerations for signal validation include:
- Analyzing the market trend
- Confirming signals with additional technical indicators
- Evaluating the magnitude of price movements
- Assessing overall market volatility
Practical Application in Trading Strategies
Successful traders use MACD signals as part of a comprehensive trading approach. The indicator provides insights into potential entry and exit points, helping traders manage risk and capitalize on market momentum. By understanding the nuanced information provided by MACD signals, traders can develop more sophisticated and informed trading strategies.
Learn more about advanced technical analysis techniques to enhance your trading skills and decision-making process.
Real-World Applications of MACD in Different Markets
The Moving Average Convergence Divergence (MACD) indicator transcends individual markets, offering traders a versatile tool for analyzing momentum across various financial instruments. Its adaptability makes it a powerful asset for trading strategies in stocks, forex, cryptocurrencies, and commodity markets.
MACD in Stock Market Trading
In stock markets, MACD serves as a critical momentum indicator for identifying trend reversals and potential trading opportunities. Traders utilize this tool to assess the performance of individual stocks and broader market indices. By comparing short-term and long-term moving averages, investors can detect subtle shifts in market sentiment and make more informed investment decisions.
Key applications in stock markets include:
- Identifying potential trend reversals
- Assessing momentum in individual stocks
- Analyzing sector-wide market movements
- Confirming price trend sustainability
Forex and Cryptocurrency Market Strategies
According to market research on trading strategies, MACD proves particularly effective in volatile markets like forex and cryptocurrencies. Traders leverage this indicator to navigate rapid price fluctuations and identify potential entry and exit points in these dynamic trading environments.
Important considerations for forex and crypto trading include:
- Rapid Signal Generation: Quick identification of momentum changes
- Volatility Adaptation: Effectiveness in high-volatility markets
- Multi-Timeframe Analysis: Applicability across different trading periods
Commodity and Futures Market Applications
Traders in commodity and futures markets rely on MACD to develop sophisticated trading strategies. The indicator helps in understanding underlying market trends, managing risk, and making data-driven decisions across various commodity classes.
The following table compares how traders apply MACD in various financial markets, highlighting specific uses and advantages in each context.
| Market Type | Key MACD Applications | Special Considerations |
|---|---|---|
| Stock Market | Spotting trend reversals, evaluating momentum, confirming trends | Useful for individual stocks and indices |
| Forex | Quick signal generation, managing volatility, timing entries/exits | Well-suited to high volatility |
| Cryptocurrency | Detecting momentum shifts, multi-timeframe analysis | Responds well to rapid price moves |
| Commodities | Assessing broader trends, managing risk, supporting futures trades | Versatile across commodity classes |
Explore our advanced trading analysis techniques to enhance your understanding of market indicators and trading strategies.
Ready to Turn MACD Knowledge Into Real Trading Results?
Understanding MACD is the first step, but the challenge most beginners face is actually applying this powerful indicator in fast-moving markets. Many traders struggle to interpret crossover signals or hesitate to trust momentum shifts in live trading. The fear of missing out or making costly mistakes can hold you back from your true trading potential.

Now is the time to transform your MACD insights into confident decisions. Join FrankFX and unlock access to live trading sessions, daily signals, and expert mentorship that make technical tools like MACD come alive in real markets. Explore our collection of advanced indicators and tools designed for both forex and crypto traders, and gain a competitive edge with our comprehensive technical analysis resources. Take the next step now so you can stop second-guessing your trades and start seeing measurable improvement in your trading results.
Frequently Asked Questions
What is the MACD indicator and how does it work?
The Moving Average Convergence Divergence (MACD) is a momentum indicator that shows the relationship between two moving averages of an asset’s price, helping traders identify trend direction and momentum shifts.
How do you interpret MACD signals in trading?
MACD signals are interpreted through crossovers, divergences, and changes in the MACD histogram. A bullish crossover occurs when the MACD line crosses above the signal line, while a bearish crossover occurs when it crosses below. Divergence signals indicate a conflict between price movement and the MACD line.
Why do traders rely on the MACD indicator?
Traders use the MACD indicator to identify potential trend reversals, momentum changes, and overbought or oversold conditions. It aids in making informed decisions regarding entry and exit points in different financial markets.
Can MACD be used in different financial markets?
Yes, the MACD indicator is versatile and can be effectively utilized in various markets including stocks, forex, cryptocurrencies, and commodities, making it a valuable tool for traders across different financial instruments.
Recommended
- MACD-2 Indicator
- Technical Analysis Explained
- Technical Analysis for Beginners
- Trading With Moving Averages
